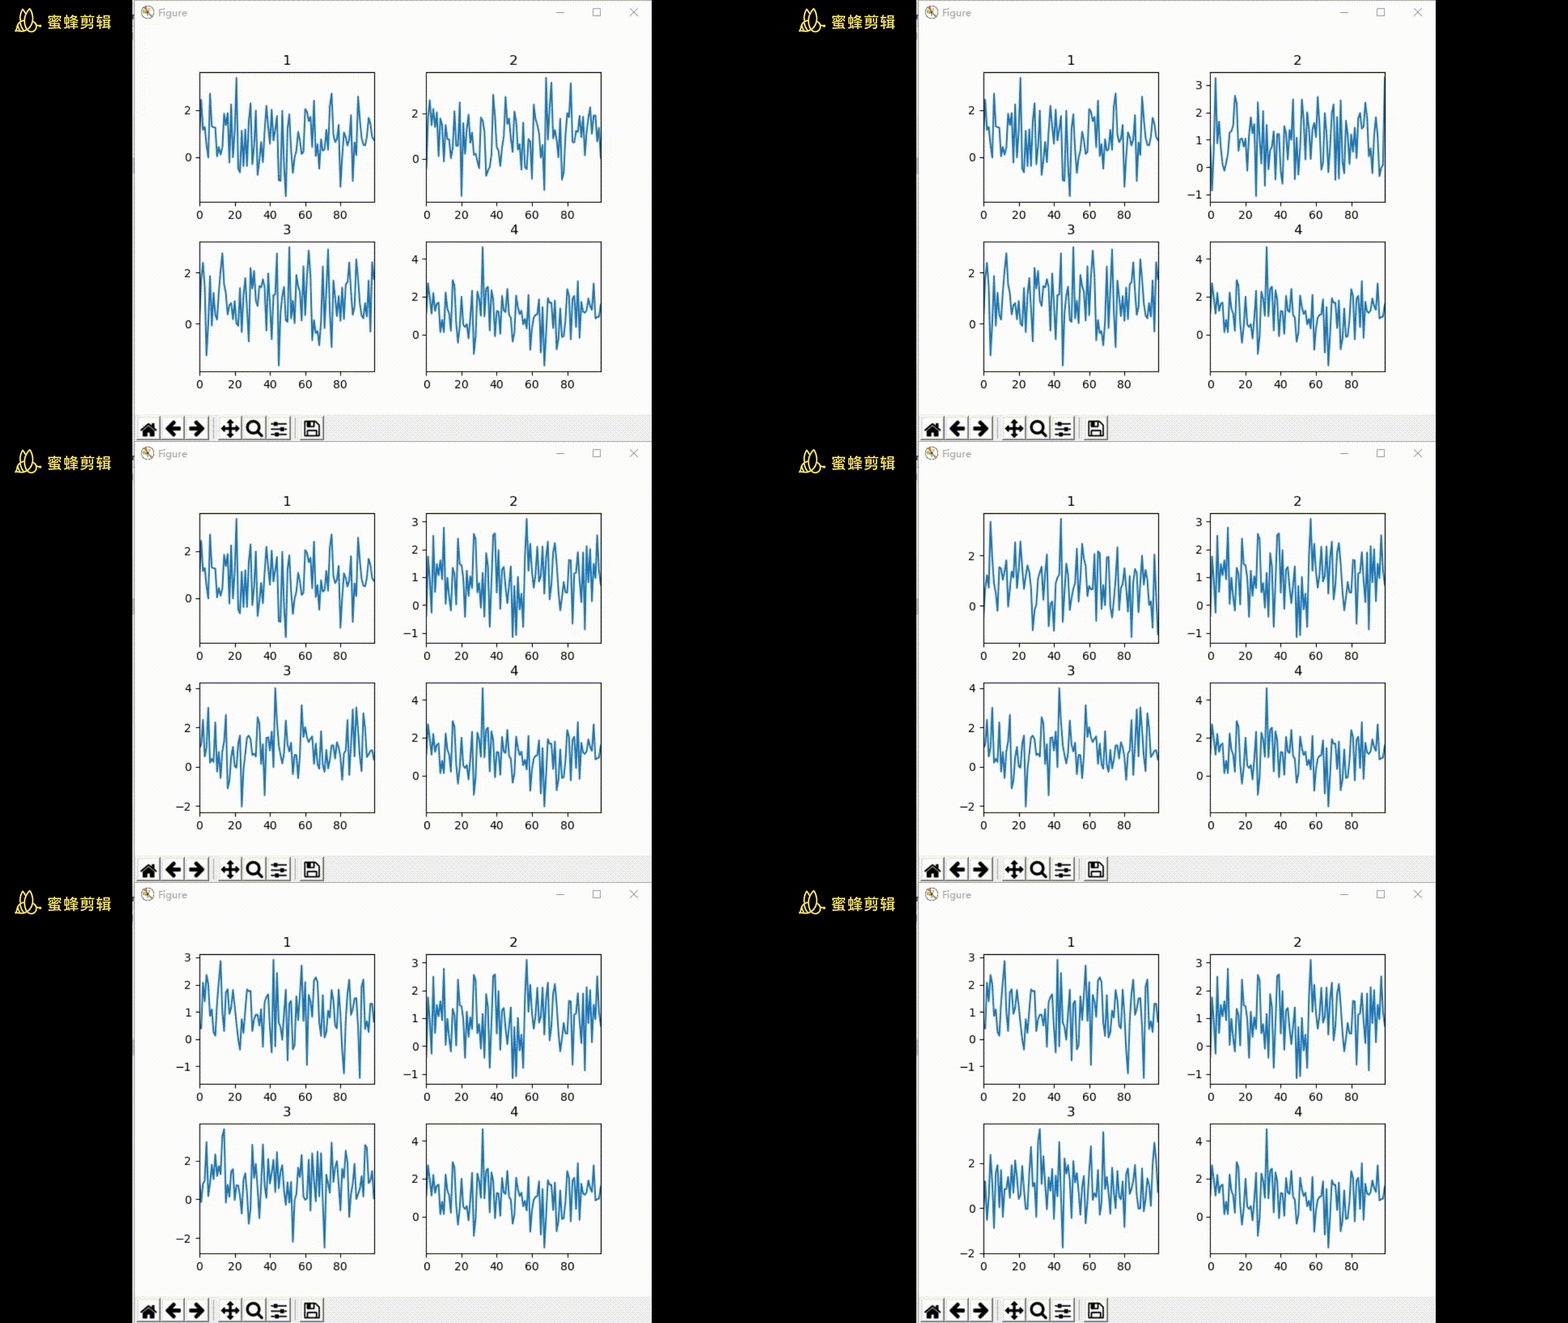
matplotlib實現數據實時刷新的示例代碼
前言
matplotlib是python下非常好用的一個數據可視化套件,網上相關的教程也非常豐富,使用方便。本人需求一個根據實時數據刷新曲線的上位機軟件,找瞭半天,基本上都是使用matplotlib的交互模式,我折騰半天還是沒有實現想要的效果,但卻通過另一種方法實現瞭想要的效果。

源碼
註釋已經很充分,不多贅述,直接看源碼。
import matplotlib.pyplot as plt
import numpy as np
import threading
import sys
from random import random, randrange
from time import sleep

'''
繪制2x2的畫板
可設置窗口標題和4個子圖標題
可更新曲線數據
'''
quit_flag = False # 退出標志


class Plot2_2(object):
  """ 2x2的畫板 """

  def __init__(self, wtitle='Figure', p1title='1', p2title='2', p3title='3',
         p4title='4'):
    self.sub_title = [p1title, p2title, p3title, p4title] # 4個子圖的標題
    self.fig, self.ax = plt.subplots(2, 2) # 創建2X2子圖
    self.fig.subplots_adjust(wspace=0.3, hspace=0.3) # 設置子圖之間的間距
    self.fig.canvas.set_window_title(wtitle) # 設置窗口標題

    # 子圖字典,key為子圖的序號,value為子圖句柄
    self.axdict = {0: self.ax[0, 0], 1: self.ax[0, 1], 2: self.ax[1, 0], 3: self.ax[1, 1]}

  def showPlot(self):
    """ 顯示曲線 """
    plt.show()

  def setPlotStyle(self, index):
    """ 設置子圖的樣式,這裡僅設置瞭標題 """
    self.axdict[index].set_title(self.sub_title[index], fontsize=12)

  def updatePlot(self, index, x, y):
    """
    更新指定序號的子圖
    :param index: 子圖序號
    :param x: 橫軸數據
    :param y: 縱軸數據
    :return:
    """
    # X軸數據必須和Y軸數據長度一致
    if len(x) != len(y):
      ex = ValueError("x and y must have same first dimension")
      raise ex

    self.axdict[index].cla() # 清空子圖數據
    self.axdict[index].plot(x, y) # 繪制最新的數據
    self.setPlotStyle(index) # 設置子圖樣式
    if min(x) < max(x):
      self.axdict[index].set_xlim(min(x), max(x)) # 根據X軸數據區間調整X軸范圍
    plt.draw()
    print("%s end" % sys._getframe().f_code.co_name)


def updatePlot(plot):
  """
  模擬收到實時數據,更新曲線的操作
  :param plot: 曲線實例
  :return:
  """
  print("Thread: %s" % threading.current_thread().getName())
  count = 0
  global quit_flag
  print("quit_flag[%s]" % str(quit_flag))
  while True:
    if quit_flag:
      print("quit_flag[%s]" % str(quit_flag))
      break
    count += 1
    print("count#%d" % count)
    x = np.arange(0, 100, 1)
    y = np.random.normal(loc=1, scale=1, size=100) # 產生隨機數,模擬變化的曲線
    index = randrange(4) # 隨機更新某一個子圖
    plot.updatePlot(index, x, y)
    sleep(random() * 3)


def main():
  p = Plot2_2() # 創建一個2X2畫板

  t = threading.Thread(target=updatePlot, args=(p,)) # 啟動一個線程更新曲線數據
  t.start()

  p.showPlot() # showPlot方法會阻塞當前線程,直到窗口關閉
  print("plot close")
  global quit_flag
  quit_flag = True # 通知更新曲線數據的線程退出

  t.join()
  print("Thread: %s end" % threading.current_thread().getName())


if __name__ == '__main__':
  main()
結語
上述方法初步實現瞭根據實時數據刷新曲線的效果,目前測試發現偶爾程序無法完全退出,還有待改進。到此這篇關於matplotlib實現數據實時刷新的示例代碼的文章就介紹到這瞭,更多相關matplotlib 數據實時刷新內容請搜索WalkonNet以前的文章或繼續瀏覽下面的相關文章希望大傢以後多多支持WalkonNet!
推薦閱讀:
- python數學建模之Matplotlib 實現圖片繪制
- Python 可視化matplotlib模塊基礎知識
- Python Matplotlib數據可視化模塊使用詳解
- python threading模塊的使用指南
- python 繪制3D圖案例分享