Prometheus的安裝和配置教程詳解
1. 從官網選擇Prometheus版本進行下載
官網地址>> https://github.com/prometheus/prometheus/releases/
2. 實驗安排
在主機192.168.153.137上安裝prometheus監控192.168.153.138上的mysql服務和主機狀態
3. 上傳軟件包到137服務器並配置
3.1 將軟件包解壓到 /usr/local 目錄下
tar xzf prometheus-2.24.1.linux-amd64.tar.gz -C /usr/local/
3.2 給目錄創建軟鏈接
ln -s /usr/local/prometheus-2.24.1.linux-amd64/ /usr/local/prometheus
3.3 切換到目錄下
cd /usr/local/prometheus
3.4 修改配置文件 prometheus.yml,配置要監控的項
scrape_configs:
 # The job name is added as a label `job=<job_name>` to any timeseries scraped from this config.
 - job_name: 'prometheus'

 # metrics_path defaults to '/metrics'
 # scheme defaults to 'http'.

 static_configs:
 - targets: ['localhost:9090']
 #監控Linux主機狀態
 - job_name: 'linux'
 static_configs:
 - targets: ['192.168.153.138:9100']
 #監控mysql服務狀態
 - job_name: 'mysql'
 static_configs:
 - targets: ['192.168.153.138:9104']
3.5 啟動promethus服務
./prometheus --config.file=prometheus.yml
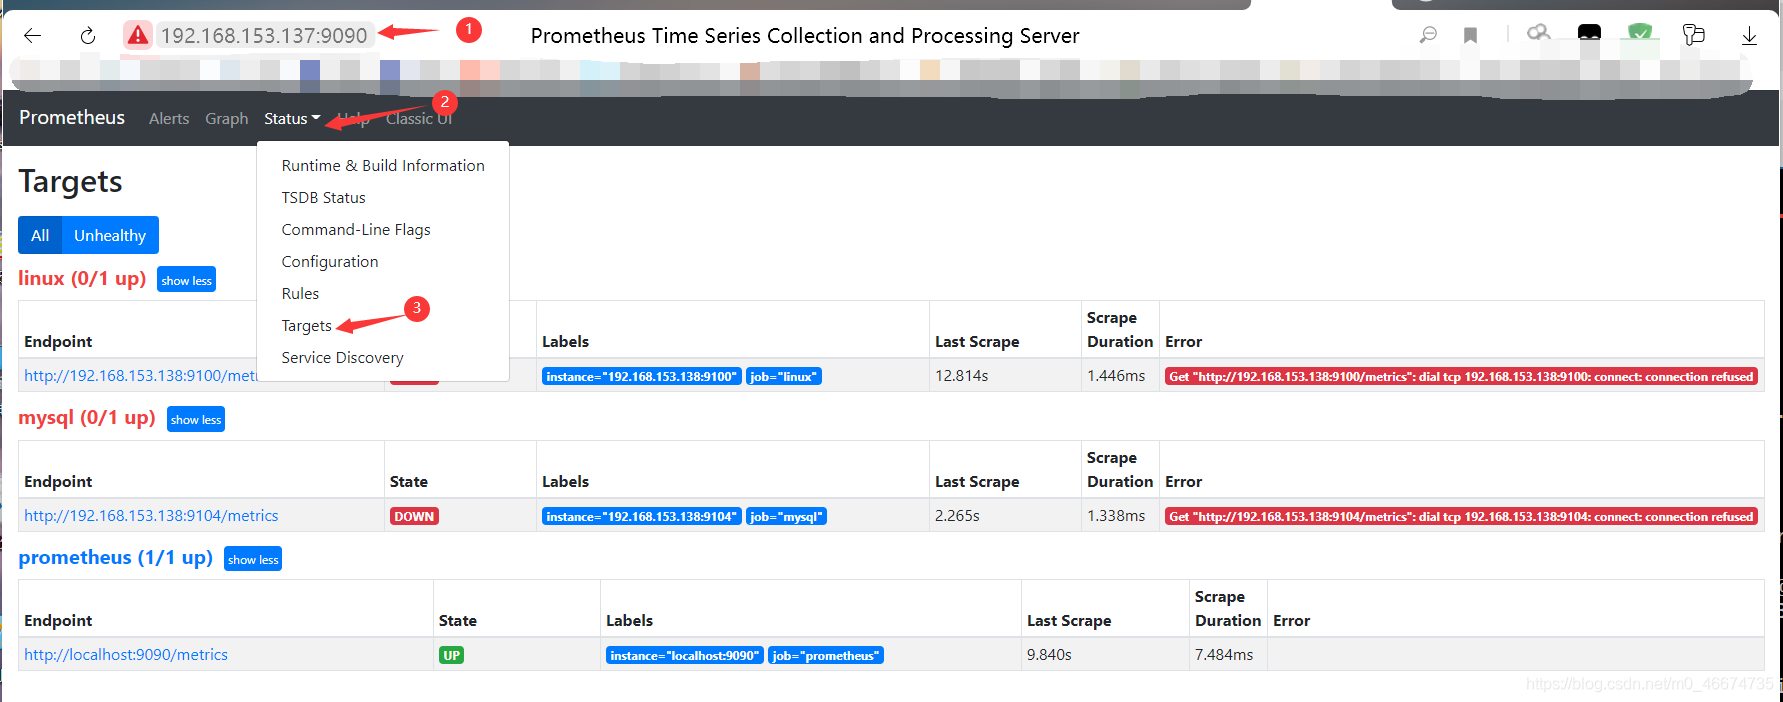
3.6 瀏覽器輸入 IP:9090 查看
在Status->Targets頁面下,我們可以看到我們配置的兩個Target,它們的State為DOWN。
4. 配置138主機 4.1 下載exporter
下載地址>> https://github.com/prometheus/node_exporter/releases
4.2 將軟件包解壓到 /usr/local 目錄下
tar xzf node_exporter-1.0.1.linux-amd64.tar.gz -C /usr/local/
4.3 啟動exporter
nohup /usr/local/node_exporter-1.0.1.linux-amd64/node_exporter &
4.4 下載mysqld_exporter
下載地址>> https://github.com/prometheus/mysqld_exporter/releases
4.5 將軟件包解壓到 /usr/local 目錄下
tar xzf mysqld_exporter-0.12.1.linux-amd64.tar.gz -C /usr/local/
4.6 數據庫給mysqld_exporter授權
[root@host-138 ~]# mysql
Welcome to the MariaDB monitor. Commands end with ; or \g.

MariaDB [(none)]> GRANT REPLICATION CLIENT,PROCESS ON *.* TO 'mysql_monitor'@'localhost' identified by 'mysql_monitor';
Query OK, 0 rows affected (0.00 sec)

MariaDB [(none)]> GRANT SELECT ON *.* TO 'mysql_monitor'@'localhost';
Query OK, 0 rows affected (0.00 sec)
4.7 創建 .my.cnf 配置文件
vim /usr/local/mysqld_exporter-0.12.1.linux-amd64/.my.cnf
內容為:
[client]
user=mysql_monitor
password=mysql_monitor
4.8 運行mysqld_exporter服務
nohup /usr/local/mysqld_exporter-0.12.1.linux-amd64/mysqld_exporter --config.my-cnf="/usr/local/mysqld_exporter-0.12.1.linux-amd64/.my.cnf" &
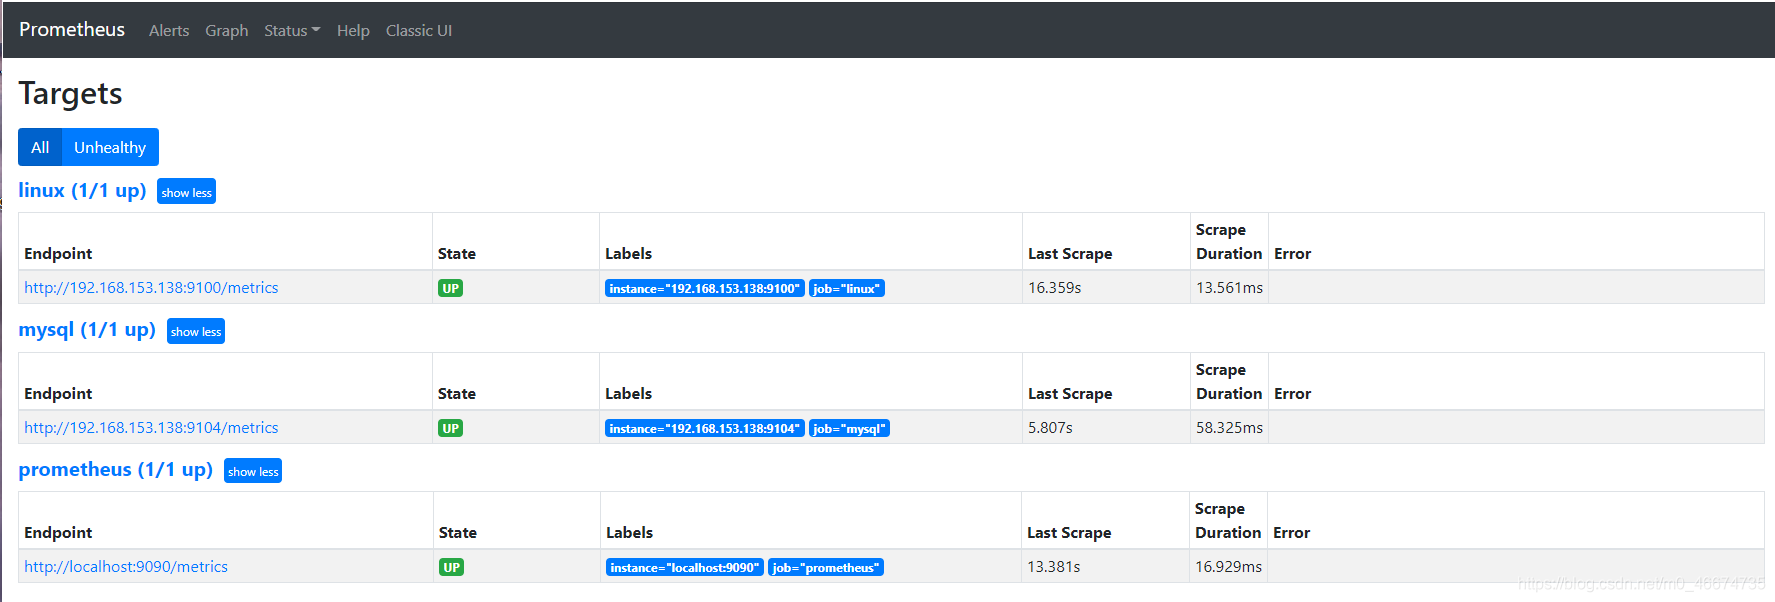
5. 在promethus頁面刷新Status->Targets頁面,可以看到配置的兩個Target的State為UP:
5. 在137主機上安裝部署grafana
安裝教程鏈接>>https://www.jb51.net/article/204660.htm
5.1 添加promethus數據源 未完待續…
到此這篇關於Prometheus的安裝和配置教程詳解的文章就介紹到這瞭,更多相關Prometheus安裝和配置內容請搜索WalkonNet以前的文章或繼續瀏覽下面的相關文章希望大傢以後多多支持WalkonNet!
推薦閱讀:
- Redis性能監控的實現
- prometheus監控節點程序的安裝及卸載命令
- 一文秒懂Prometheus 介紹及工作原理
- 使用docker部署grafana+prometheus配置
- Prometheus監控實戰篇Nginx、Hbase操作詳解