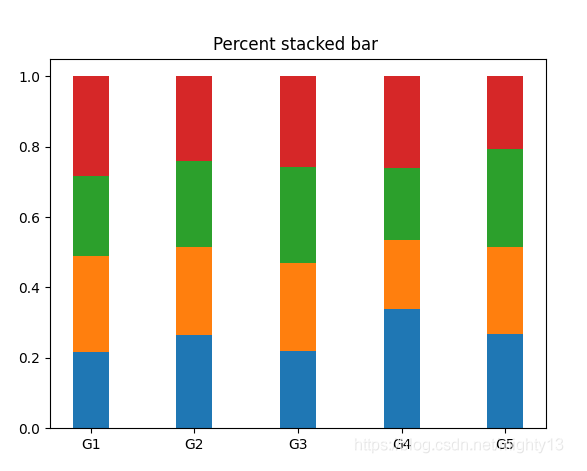
matplotlib bar()實現百分比堆積柱狀圖
使用matplotlib創建百分比堆積柱狀圖的思路與堆積柱狀圖類似,隻不過bottom參數累計的不是數值而是百分比,因此,需要事先計算每組柱子的數值總和,進而求百分比。

未使用numpy版本
適用於少量數據,數據結構需要手動構造。
import matplotlib.pyplot as plt

labels = ['G1', 'G2', 'G3', 'G4', 'G5']
first = [20, 34, 30, 35, 27]
second = [25, 32, 34, 20, 25]
third = [21, 31, 37, 21, 28]
fourth = [26, 31, 35, 27, 21]
data = [first, second, third, fourth]

x = range(len(labels))
width = 0.35

# 將bottom_y元素都初始化為0
bottom_y = [0] * len(labels)
# 計算每組柱子的總和,為計算百分比做準備
sums = [sum(i) for i in zip(first, second, third, fourth)]
for i in data:
 # 計算每個柱子的高度,即百分比
 y = [a/b for a, b in zip(i, sums)]
 plt.bar(x, y, width, bottom=bottom_y)
 # 計算bottom參數的位置
 bottom_y = [(a+b) for a, b in zip(y, bottom_y)]

plt.xticks(x, labels)
plt.title('Percent stacked bar ')
plt.show()
使用numpy版本
第一個版本的缺陷在於數據需要手動構造,而且計算稍微繁瑣一些。
使用numpy便於處理規模比較大且已存儲在文件中數據的數據,計算更簡便。
import numpy as np
import matplotlib.pyplot as plt

labels = ['G1', 'G2', 'G3', 'G4', 'G5']
first = [20, 34, 30, 35, 27]
second = [25, 32, 34, 20, 25]
third = [21, 31, 37, 21, 28]
fourth = [26, 31, 35, 27, 21]
data = [first, second, third, fourth]

x = range(len(labels))
width = 0.35

# 將bottom_y元素都初始化為0
bottom_y = np.zeros(len(labels))
data = np.array(data)
# 按列計算計算每組柱子的總和,為計算百分比做準備
sums = np.sum(data, axis=0)
for i in data:
 # 計算每個柱子的高度,即百分比
 y = i / sums
 plt.bar(x, y, width, bottom=bottom_y)
 # 計算bottom參數的位置
 bottom_y = y + bottom_y

plt.xticks(x, labels)
plt.title('Percent stacked bar ')
plt.show()
到此這篇關於matplotlib bar()實現百分比堆積柱狀圖 的文章就介紹到這瞭,更多相關matplotlib 百分比堆積柱狀圖 內容請搜索WalkonNet以前的文章或繼續瀏覽下面的相關文章希望大傢以後多多支持WalkonNet!
推薦閱讀:
- Python數據分析應用之Matplotlib數據可視化詳情
- matplotlib bar()實現多組數據並列柱狀圖通用簡便創建方法
- Python數據分析之Matplotlib數據可視化
- Python matplotlib.pyplot.hist()繪制直方圖的方法實例
- Python用 matplotlib 繪制柱狀圖