在 ASP.Net Core 中使用 MiniProfiler的方法
web應用程序的性能相信是大傢普遍關心的一個問題,也相信大傢有很多工具可用來分析應用程序的性能並能夠找到其中的瓶頸,MiniProfiler 就是這個領域中的一款產品,它是一款簡單的,功能強大的web應用分析工具,MiniProfiler 可用來幫助我們找到 慢查詢, 慢響應 等問題。
MiniProfiler 可用在 Asp.Net 和 ASP.Net Core 中,這篇文章將會討論如何使用 MiniProfiler,並通過它找到應用程序的性能問題。
安裝 MiniProfiler
要想使用 MiniProfiler,需要通過 nuget 引用 MiniProfiler.AspNetCore.Mvc 包,可以通過 Visual Studio 2019 的 NuGet package manager 可視化界面安裝 或者 通過 NuGet package manager 命令行工具輸入以下命令:
dotnet add package MiniProfiler.AspNetCore.Mvc
安裝好之後,接下來就要將 MiniProfiler 註入到 ServiceCollection 容器中,如下代碼所示:
 // This method gets called by the runtime. Use this method to add services to the container.
    public void ConfigureServices(IServiceCollection services)
    {
      services.AddControllersWithViews();

      services.AddMiniProfiler(options => options.RouteBasePath = "/profiler");
    }
註入好之後,接下來就需要使用 UseMiniProfiler 擴展方法將其註入到 Request Pipeline 管道中,如下代碼所示:
 public void Configure(IApplicationBuilder app, IWebHostEnvironment env, ILoggerFactory loggerFactory)
    {
      app.UseMiniProfiler();

      app.UseEndpoints(endpoints =>
      {
        endpoints.MapControllerRoute(
          name: "default",
          pattern: "{controller=Home}/{action=Index}/{id?}");
      });
    }
然後在 _Layout.cshtml 頁面中增加如下兩行命令。
@using StackExchange.Profiling
@addTagHelper *, MiniProfiler.AspNetCore.Mvc
最後需要在 WebPage 中指定 MiniProfiler 分析窗口應該顯示的位置,那如何做呢? 在 body 標簽內使用 mini-profiler 標記,如下代碼所示:
<mini-profiler position="@RenderPosition.Right" max-traces="5" />
在 ASP.Net Core MVC 中使用 MiniProfiler
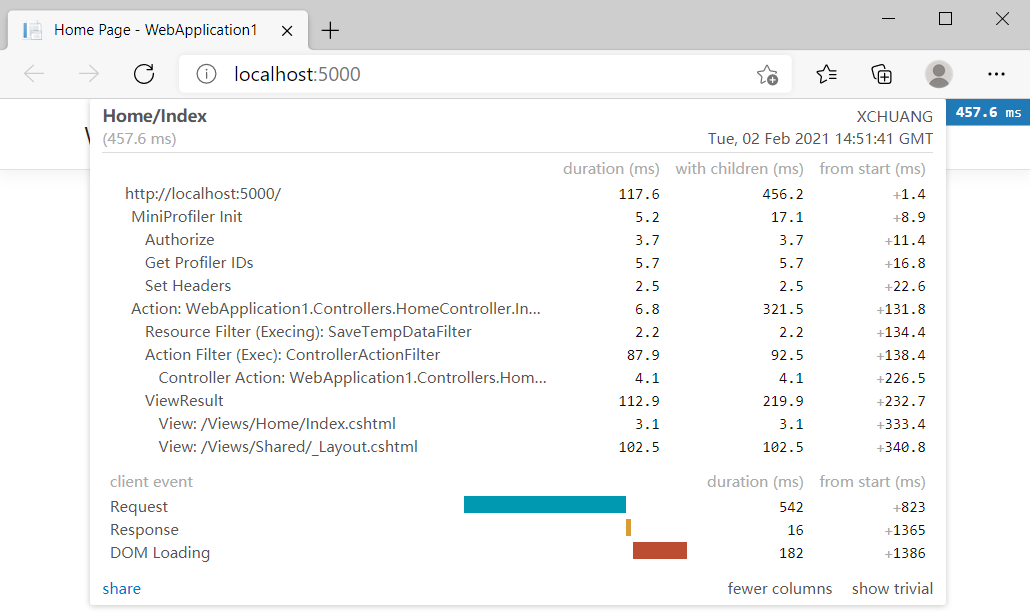
MiniProfiler 會提供 頁面加載時間 和 數據庫查詢性能指標,接下來把程序跑起來,你會看到如下的性能指標圖。
有些朋友可能就要問瞭,大體時間我是知道瞭,那如果我隻想獲取某一指定代碼塊的執行時間呢? 當然也是可以的,下面的代碼展示瞭如何去實現。
 public class HomeController : Controller
  {
    ILogger<HomeController> logger;

    public HomeController(ILogger<HomeController> logger)
    {
      this.logger = logger;
    }

    public IActionResult Index()
    {
      var miniProfiler = MiniProfiler.Current;
      List<Author> authors = new List<Author>();

      miniProfiler.RenderIncludes(this.HttpContext);

      using (miniProfiler.Step("Get Authors"))
      {
        authors.Add(new Author() { Id = 1, FirstName = "Joydip", LastName = "Kanjilal", Address = "Hyderabad, India" });
        authors.Add(new Author() { Id = 2, FirstName = "Stephen", LastName = "Smith", Address = "NY, USA" });
        authors.Add(new Author() { Id = 3, FirstName = "Anand", LastName = "Narayanan", Address = "Chennai, India" });
        authors.Add(new Author() { Id = 4, FirstName = "Steve", LastName = "Jones", Address = "London, UK" });
      }
      return View(authors);
    }
  }

  public class Author
  {
    public int Id { get; set; }
    public string FirstName { get; set; }
    public string LastName { get; set; }
    public string Address { get; set; }
  }
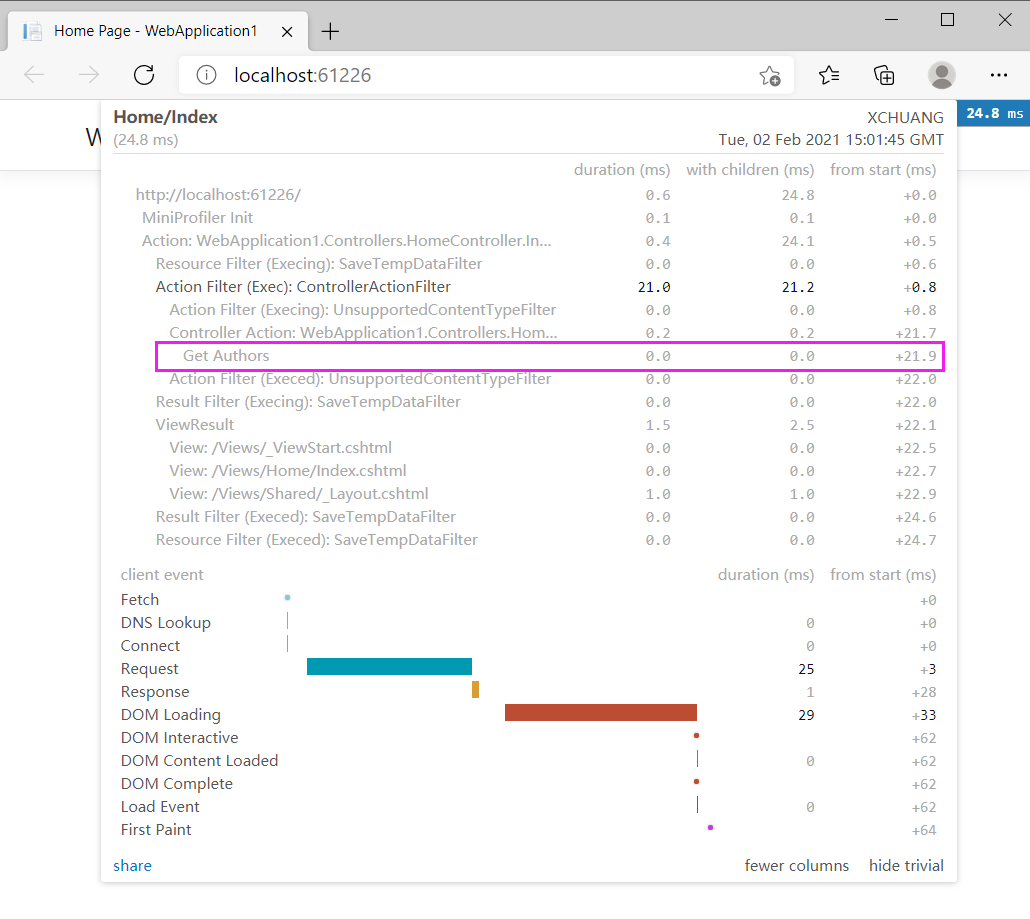
從上面的代碼中可以看到,我用 using (miniProfiler.Step("Get Authors")) 做瞭語句塊標記,理論上 mini-profile 窗口上應該有類似 Get Authors 指標欄,接下來把程序跑起來,一起來看看效果。
除瞭順向操作,你也可以指定讓某些代碼塊不要顯示在 mini-profile 中,需要做的是調用 Ignore() 即可,如下代碼所示:
using (MiniProfiler.Current.Ignore())
{
 // Write code here that you don't
 // want MiniProfiler to profile
}
使用 MiniProfile 分析 ADO.NET 查詢
除瞭做一些常規的頁面分析,還可以直接對 ADO.NET 查詢性能進行分析,這就
 瞭,要這麼做的話,需要使用
 ProfileDbConnection 和 ProfileDbCommand 即可,如下代碼所示:
   public IActionResult Index()
    {
      using (SqlConnection connection = new SqlConnection(@"Data Source=.; Initial Catalog=PYZ_L; Trusted_Connection=Yes"))
      {
        using (ProfiledDbConnection profiledDbConnection = new ProfiledDbConnection(connection, MiniProfiler.Current))
        {
          if (profiledDbConnection.State != System.Data.ConnectionState.Open)
          {
            profiledDbConnection.Open();
          }

          using (SqlCommand command = new SqlCommand("Select * From Clothes", connection))
          {
            using (ProfiledDbCommand profiledDbCommand = new ProfiledDbCommand(command, connection, MiniProfiler.Current))
            {
              var data = profiledDbCommand.ExecuteReader();
              //Write code here to populate the list of Authors
            }
          }
        }
      }

      return View();
    }
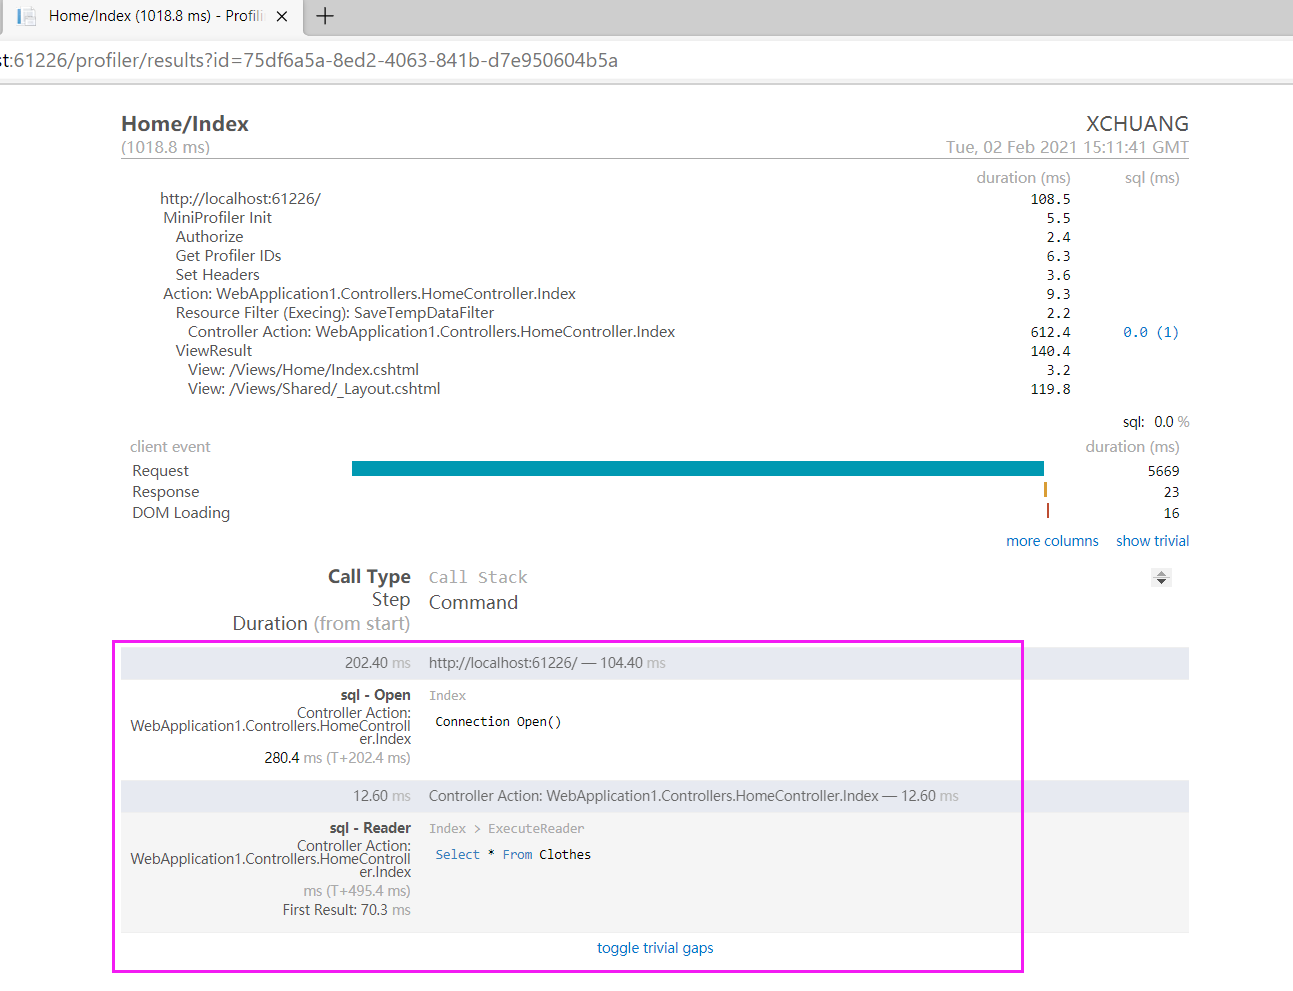
從上圖可以看到,確實對 ADO.NET 查詢有著清晰的分析,相信在幫助大傢分析問題時很有幫助。
MiniProfiler 是一個可應用於 .NET, Ruby, Go 和 Node.js 的性能分析工具,你可以使用 MiniProfiler 去分析 Dapper,Linq2SQL,Entity Framework 所使用的sql的查詢性能,此外 MimiProfile 之所以 Mini,意味著它介入到你的應用程序中所帶來的性能開銷微乎其微,所以大傢可放心的丟到生產上去吧!
到此這篇關於在 ASP.Net Core 中使用 MiniProfiler的方法的文章就介紹到這瞭,更多相關 ASP.Net Core 使用 MiniProfiler內容請搜索WalkonNet以前的文章或繼續瀏覽下面的相關文章希望大傢以後多多支持WalkonNet!
推薦閱讀:
- 詳解如何在ASP.NET Core Web API中以三種方式返回數據
- 使用VS2022在ASP.NET Core中構建輕量級服務
- 詳解如何在C#中使用投影(Projection)
- 在ASP.Net Core中使用Lamar的全過程
- ASP.NET Core中的配置詳解