利用Matlab提取圖片曲線
利用 MATLAB 提取圖片曲線
給你一張圖片,如何提取裡面曲線的數據,從而利用這些數據進行圖像重繪、加工處理、測距、擬合得到函數表達式等操作呢?
行文動機
前段時間,有個朋友問瞭我一個問題,大概意思就是要給圖像的流線測距離,在我的印象裡面,MATLAB 是似乎沒有這種直接的功能的。
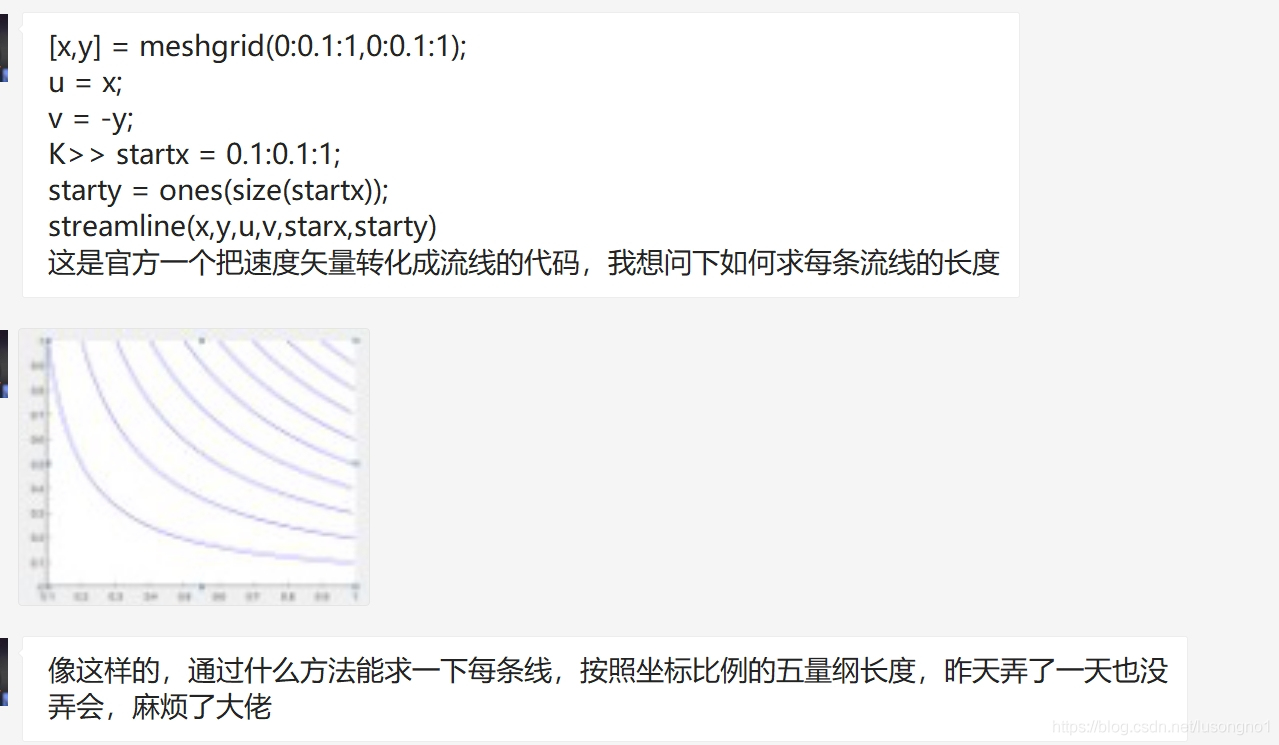
那麼換個角度來理解一下這個問題,如果給你一張圖像,如何提取裡面點的數據?其實,有瞭曲線的數據,後面想幹嘛就幹嘛瞭。
一直沒空弄這個,今天偷閑,安排!!!
圖像的讀入與裁剪
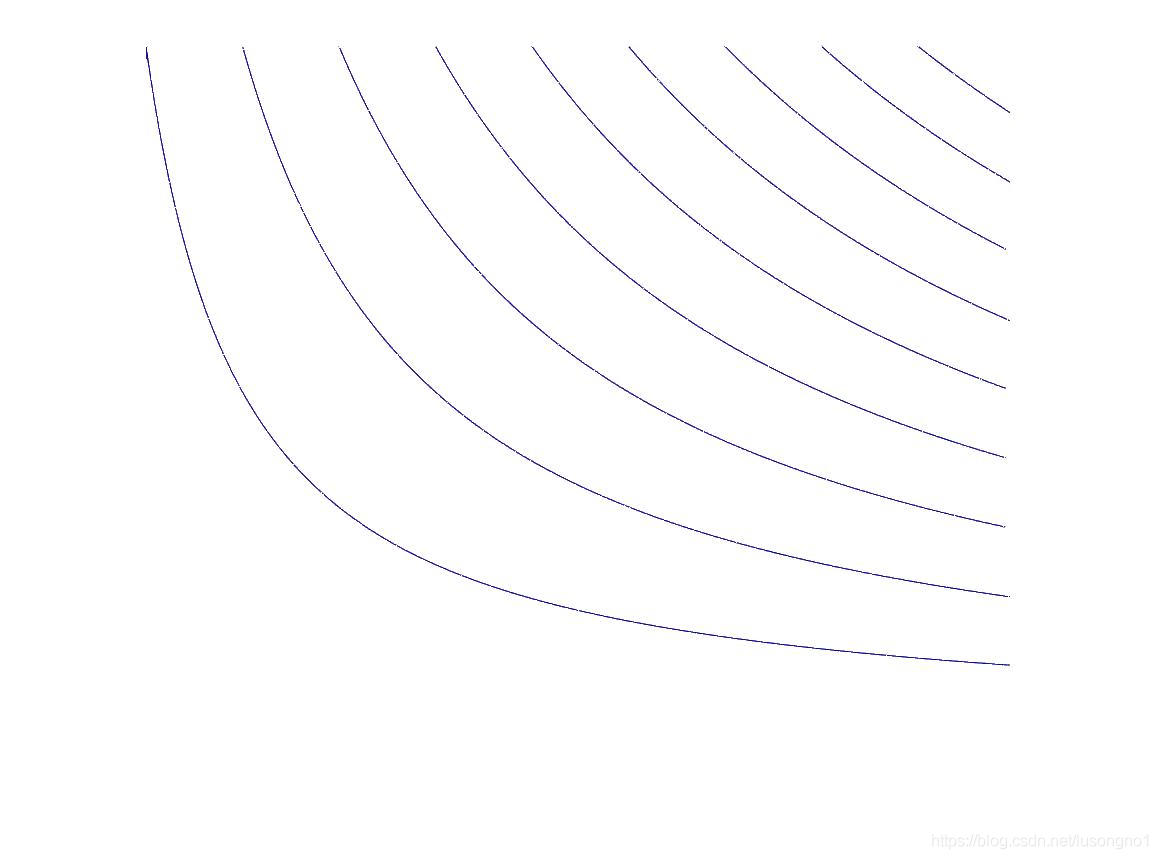
以下面的圖像作為例子。

我們先導入圖像,進行簡單的裁剪。為什麼要裁剪呢?其實不裁剪也沒關系,因為我後面是基於像素點的顏色來提取的曲線。如果你想提取的曲線不能通過顏色區分,那麼,最好通過裁剪,把你不想要的部分盡可能地剪掉。
%% 讀入圖片,展示,有必要的話可以適當做一些裁剪
A = imread('a.jpg');%讀取到一張圖片
imshow(A);
A = imcrop(A);%使用鼠標裁剪一波
imshow(A);
[low_num,col_num,~] = size(A);
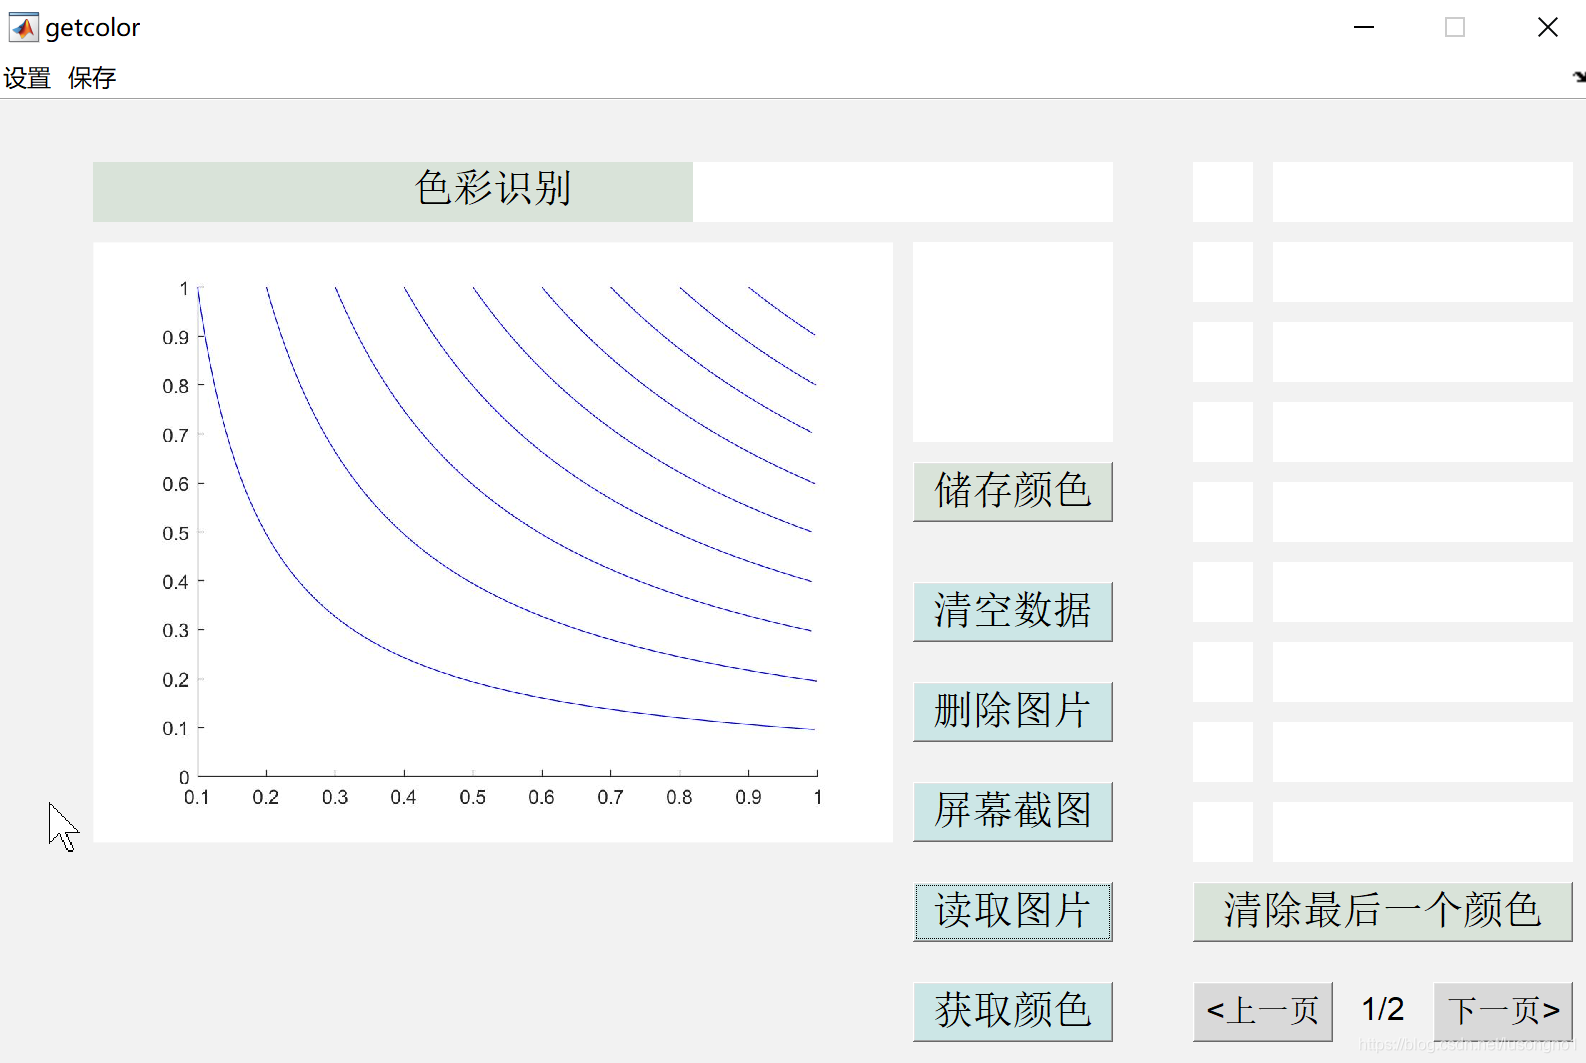
顏色拾取
觀察圖像發現,我們要提取的曲線是藍色的,所以我希望通過顏色把它區分出來。那麼我們就要知道這個曲線的 RGB 值。我希望通過鼠標點選的方式獲取到顏色值。
這裡我偷個懶,直接采用瞭 slandarer 開源的顏色提取工具。這個模塊不是我寫的,特此聲明,請尊重原創。
%% 顏色提取
getcolor();
color = color_list_temp(1,:);
function getcolor
global control;
global ima;
global GUI;
global x_limit;
global y_limit;
global color;
global a;
global color_number;
global color_list;
global page;
global total_page;
global color_list_temp;
color=[];
page=1;
total_page=2;
color_list=[0 0 0];
color_list(1,:)=[];
color_number=1;
rgb_type=1;
%%%%%%%%%%%%%%%%%%%%%%%%%%%%%%%%%%%%%%%%%%%%%%%%%%%%%%%%%%%%%%%%%%%%%%%%%%%
GUI.fig=figure('units','pixels',...
    'position',[350 100 800 500],...
    'Numbertitle','off',...
    'menubar','none',...
    'resize','off',...
    'name','getcolor',...
    'color',[0.95 0.95 0.95]);
%%%%%%%%%%%%%%%%%%%%%%%%%%%%%%%%%%%%%%%%%%%%%%%%%%%%%%%%%%%%%%%%%%%%%%%%%%%
uh1=uimenu('label','設置');
uimenu(uh1,'label','RGB類型設置','callback',@RGBset)
    function RGBset(~,~)
        GUI.rgbfig=figure('units','pixels',...
        'position',[360 370 180 200],...
        'Numbertitle','off',...
        'menubar','none',...
        'name','RGBset',...
        'resize','off');
        GUI.axes=axes('Units','pixels',...
         'parent',GUI.rgbfig,...
        'PlotBoxAspectRatio',[1 1 1],...
        'Color',[0.95 0.95 0.95],...
        'Box','on', ...
        'XLim',[0 500],...
        'YLim',[0 500], ...
        'XColor',[0.95 0.95 0.95],...
        'YColor',[0.95 0.95 0.95],...
        'YDir','reverse', ...
        'xtick',[],'ytick',[]);
        GUI.checkbox1=uicontrol('parent',GUI.rgbfig,...
            'style','checkbox',...
            'string','范圍:0-1',...
            'position',[45 150 400 30],...
            'fontsize',10,...
            'value',rgb_type,...
            'callback',@ifon1);
        GUI.checkbox255=uicontrol('parent',GUI.rgbfig,...
            'style','checkbox',...
            'string','范圍:0-255',...
            'position',[45 120 400 30],...
            'fontsize',10,...
            'value',~rgb_type,...
            'callback',@ifon255);
        GUI.makesurebutton=uicontrol('parent',GUI.rgbfig,...
            'style','pushbutton',...
            'string','確定設置',...
            'position',[45 70 100 25],...
            'fontsize',10,...
            'callback',@settype);

        function ifon1(~,~)
            if(get(GUI.checkbox1,'value')==1)
                set(GUI.checkbox1,'value',1);
                set(GUI.checkbox255,'value',0);
            else
                set(GUI.checkbox1,'value',1);
            end
        end
        function ifon255(~,~)
            if(get(GUI.checkbox255,'value')==1)
                set(GUI.checkbox255,'value',1);
                set(GUI.checkbox1,'value',0);
            else
                set(GUI.checkbox255,'value',1);
            end
        end
        function settype(~,~)
            rgb_type=get(GUI.checkbox1,'value');
            if ~isempty(color)
                set(GUI.text2,'string',['[',num2str((color/255).*rgb_type+color.*(~rgb_type)),']']);
            end
            show_color(page);
            close(GUI.rgbfig)
        end
    end
%%%%%%%%%%%%%%%%%%%%%%%%%%%%%%%%%%%%%%%%%%%%%%%%%%%%%%%%%%%%%%%%%%%%%%%%%%%
uh2=uimenu('label','保存');
uimenu(uh2,'label','儲存為mat','callback',@saveas_mat)
uimenu(uh2,'label','儲存為txt','callback',@saveas_txt)
uimenu(uh2,'label','儲存為excel','callback',@saveas_exl)
uimenupic=uimenu(uh2,'label','儲存為對照圖');
uimenu(uimenupic,'label','儲存全部頁碼','callback',@saveas_pic_all);
uimenu(uimenupic,'label','儲存當前頁碼','callback',@saveas_pic_now);
function saveas_mat(~,~)
    try
    [filename, pathname] = uiputfile({'*.mat','mat'});
        color_list_temp=(color_list/255).*rgb_type+color_list.*(~rgb_type);
        save([pathname,filename],'color_list_temp');
    catch
    end
end
function saveas_txt(~,~)
    try
    [filename, pathname] = uiputfile({'*.txt','記事本'});
        color_list_temp=(color_list/255).*rgb_type+color_list.*(~rgb_type);
        [m,n]=size(color_list_temp);
        fid=fopen([ pathname,filename],'w');
        for ii=1:m
            for jj=1:n
                if jj==n
                    fprintf(fid,'%d\r\n',color_list_temp(ii,jj));
                else
                    fprintf(fid,'%d\r\t',color_list_temp(ii,jj));
                end
            end
        end
        fclose(fid);
    catch
    end
end
function saveas_exl(~,~)
    [filename, pathname] = uiputfile({'*.xlsx','記事本'});
    color_list_temp=(color_list/255).*rgb_type+color_list.*(~rgb_type);
    xlswrite([ pathname,filename],color_list_temp)

end
function saveas_pic_all(~,~)
    page_with_color=total_page-1;
    px=50;
    gap_px=10;
    pic=ones(9*px,page_with_color*px+(page_with_color-1)*gap_px,3);
    for p=1:page_with_color
        for ii=(p-1)*9+1:p*9
            for kk=1:3
                if ii<=length(color_list)
                    pic((ii-(p-1)*9-1)*px+1:(ii-(p-1)*9)*px,(p-1)*(px+gap_px)+1:(p-1)*(px+gap_px)+px,kk)=color_list(ii,kk)/255;
                end
            end
        end
    end
    [filename, pathname] = uiputfile({'*.jpg;*.png','All Image Files';...
            '*.jpg','JPG';'*.png','PNG' });
    imwrite(pic,[pathname,filename]);
end
function saveas_pic_now(~,~)
    try
    [m,~]=size(color_list);
    m=m-(page-1)*9;
    m(m>9)=9;
    px=50;
    pic=ones(9*px,1*px,3);
    if m>0
        for ii=(page-1)*9+1:(page-1)*9+m
            for kk=1:3
                pic((ii-1)*px+1:ii*px,1:px,kk)=color_list(ii,kk)/255;
            end
        end
    else
    end
    [filename, pathname] = uiputfile({'*.jpg;*.png','All Image Files';...
            '*.jpg','JPG';'*.png','PNG' });
    imwrite(pic,[pathname,filename]);
    catch
    end
end
%%%%%%%%%%%%%%%%%%%%%%%%%%%%%%%%%%%%%%%%%%%%%%%%%%%%%%%%%%%%%%%%%%%%%%%%%%%
%uh3=uimenu('label','導入');
%%%%%%%%%%%%%%%%%%%%%%%%%%%%%%%%%%%%%%%%%%%%%%%%%%%%%%%%%%%%%%%%%%%%%%%%%%%
GUI.text=uicontrol('parent',GUI.fig,...
    'style','text',...
    'string','色彩識別',...
    'horizontalalign','center',...
    'position',[50 440 400 30],...
    'backgroundcolor',[0.85 0.89 0.85],...
    'foregroundcolor','k',...
    'fontsize',15);
GUI.text1=uicontrol('parent',GUI.fig,...
    'style','text',...
    'string','',...
    'horizontalalign','center',...
    'position',[460 330 100 100],...
    'backgroundcolor',[1 1 1],...
    'foregroundcolor','k',...
    'fontsize',10);
GUI.text2=uicontrol('parent',GUI.fig,...
    'style','text',...
    'string','',...
    'horizontalalign','center',...
    'position',[350 440 210 30],...
    'backgroundcolor',[1 1 1],...
    'foregroundcolor','k',...
    'fontsize',10);
GUI.savecolorbutton=uicontrol('parent',GUI.fig,...
    'style','pushbutton',...
    'string','儲存顏色',...
    'position',[460 290 100 30],...
    'backgroundcolor',[0.85 0.89 0.85],...
    'foregroundcolor','k',...
    'fontsize',15,...
    'callback',@save_color);
GUI.deletedatabutton=uicontrol('parent',GUI.fig,...
    'style','pushbutton',...
    'string','清空數據',...
    'position',[460 230 100 30],...
    'backgroundcolor',[0.8 0.9 0.9],...
    'foregroundcolor','k',...
    'fontsize',15,...
    'callback',@clear_data);
GUI.deletepicbutton=uicontrol('parent',GUI.fig,...
    'style','pushbutton',...
    'string','刪除圖片',...
    'position',[460 180 100 30],...
    'backgroundcolor',[0.8 0.9 0.9],...
    'foregroundcolor','k',...
    'fontsize',15,...
    'callback',@delete_pic);
GUI.getcapbutton=uicontrol('parent',GUI.fig,...
    'style','pushbutton',...
    'string','屏幕截圖',...
    'position',[460 130 100 30],...
    'backgroundcolor',[0.8 0.9 0.9],...
    'foregroundcolor','k',...
    'fontsize',15,...
    'callback',@get_capture);
GUI.getpicbutton=uicontrol('parent',GUI.fig,...
    'style','pushbutton',...
    'string','讀取圖片',...
    'position',[460 80 100 30],...
    'backgroundcolor',[0.8 0.9 0.9],...
    'foregroundcolor','k',...
    'fontsize',15,...
    'callback',@getImage);
GUI.getcolorbutton=uicontrol('parent',GUI.fig,...
    'style','pushbutton',...
    'tag','recc',...
    'string','獲取顏色',...
    'position',[460 30 100 30],...
    'backgroundcolor',[0.8 0.9 0.9],...
    'foregroundcolor','k',...
    'fontsize',15,...
    'callback',@get_color);
%%%%%%%%%%%%%%%%%%%%%%%%%%%%%%%%%%%%%%%%%%%%%%%%%%%%%%%%%%%%%%%%%%%%%%%%%%%
for i=1:9
    GUI.text=uicontrol('parent',GUI.fig,...
    'tag',num2str(i),...
    'style','text',...
    'string','',...
    'horizontalalign','left',...
    'position',[600 440-40*(i-1) 30 30],...
    'backgroundcolor',[1 1 1],...
    'foregroundcolor','k',...
    'fontsize',10);
end

for i=1:9
    GUI.text=uicontrol('parent',GUI.fig,...
    'tag',[num2str(i),'t'],...
    'style','text',...
    'string','',...
    'horizontalalign','center',...
    'position',[640 440-40*(i-1) 150 30],...
    'backgroundcolor',[1 1 1],...
    'foregroundcolor','k',...
    'fontsize',8);
end
%%%%%%%%%%%%%%%%%%%%%%%%%%%%%%%%%%%%%%%%%%%%%%%%%%%%%%%%%%%%%%%%%%%%%%%%%%%
GUI.inputbutton=uicontrol('parent',GUI.fig,...
    'style','pushbutton',...
    'string','清除最後一個顏色',...
    'position',[600 80 190 30],...
    'backgroundcolor',[0.85 0.89 0.85],...
    'foregroundcolor','k',...
    'fontsize',15,...
    'callback',@delete_last);
%GUI.inputbutton=uicontrol('parent',GUI.fig,...
    %'style','pushbutton',...
    %'string','導出數據',...
    %'position',[600 30 190 30],...
    %'backgroundcolor',[0.85 0.89 0.85],...
    %'foregroundcolor','k',...
    %'fontsize',15,...
    %'callback',@output_data);
%%%%%%%%%%%%%%%%%%%%%%%%%%%%%%%%%%%%%%%%%%%%%%%%%%%%%%%%%%%%%%%%%%%%%%%%%%%
GUI.lpbutton=uicontrol('parent',GUI.fig,...
    'style','pushbutton',...
    'string','<上一頁',...
    'position',[600 30 70 30],...
    'backgroundcolor',[0.85 0.85 0.85],...
    'foregroundcolor','k',...
    'fontsize',12,...
    'callback',@lastpage);
GUI.npbutton=uicontrol('parent',GUI.fig,...
    'style','pushbutton',...
    'string','下一頁>',...
    'position',[720 30 70 30],...
    'backgroundcolor',[0.85 0.85 0.85],...
    'foregroundcolor','k',...
    'fontsize',12,...
    'callback',@nextpage);
GUI.page=uicontrol('parent',GUI.fig,...
    'style','text',...
    'string',[num2str(page),'/',num2str(total_page)],...
    'horizontalalign','center',...
    'position',[670 30 50 27],...
    'backgroundcolor',[0.95 0.95 0.95],...
    'foregroundcolor','k',...
    'fontsize',12);
function lastpage(~,~)
    page=page-1;
    page(page<1)=1;
    set(GUI.page,'string',[num2str(page),'/',num2str(total_page)]);
    show_color(page);
end
function nextpage(~,~)
    page=page+1;
    page(page>total_page)=total_page;
    set(GUI.page,'string',[num2str(page),'/',num2str(total_page)]);
    show_color(page);
end

%%%%%%%%%%%%%%%%%%%%%%%%%%%%%%%%%%%%%%%%%%%%%%%%%%%%%%%%%%%%%%%%%%%%%%%%%%%
GUI.axes=axes('Units','pixels',...
      'PlotBoxAspectRatio',[1 1 1],...
      'Position',[50 30 400 400],...
      'Color',[0.98 0.98 0.98],...
      'Box','on', ...
      'XLim',[0 500],...
      'YLim',[0 500], ...
      'XColor','w','YColor','w',...
      'YDir','reverse', ...
      'Tag','picbagaxes',...
      'xtick',[],'ytick',[]);
hold on;
%%%%%%%%%%%%%%%%%%%%%%%%%%%%%%%%%%%%%%%%%%%%%%%%%%%%%%%%%%%%%%%%%%%%%%%%%%%
    %function output_data(~,~)
        %if color_number>1
            %disp(color_list)
        %end
    %end
    function show_color(cur_page)
        len_list=size(color_list,1);
        for ii=(cur_page-1)*9+1:(cur_page-1)*9+9
            if(ii<=len_list)
                set(findobj('tag',num2str(ii-(cur_page-1)*9)),'backgroundcolor',color_list(ii,:)/255)
                set(findobj('tag',[num2str(ii-(cur_page-1)*9),'t']),'string',['[',num2str((color_list(ii,:)/255).*rgb_type+color_list(ii,:).*(~rgb_type)),']'])
            else
                set(findobj('tag',num2str(ii-(cur_page-1)*9)),'backgroundcolor',[1 1 1])
                set(findobj('tag',[num2str(ii-(cur_page-1)*9),'t']),'string','')
            end
        end
    end

    function save_color(~,~)
        if ~isempty(get(GUI.text2,'string'))
            %set(findobj('tag',num2str(color_number)),'backgroundcolor',color/255)
            %set(findobj('tag',[num2str(color_number),'t']),'string',['[',num2str((color/255).*rgb_type+color.*(~rgb_type)),']'])
            color_list(color_number,:)=color;%(color/255).*rgb_type+color.*(~rgb_type);
            color_number=color_number+1;
            if color_number-1>(total_page-1)*9
                page=ceil(color_number/9);
                total_page=total_page+1;
                set(GUI.page,'string',[num2str(page),'/',num2str(total_page)]);

            end
            show_color(page)
        end
    end

    function delete_last(~,~)
        if color_number>=1
            %set(findobj('tag',num2str(color_number-1)),'backgroundcolor',[1 1 1])
            %set(findobj('tag',[num2str(color_number-1),'t']),'string','')
            color_list(end,:)=[];
            color_number=color_number-1;
            if color_number-2<=(total_page-2)*9
                page=ceil((color_number-1)/9);
                total_page=total_page-1;
                set(GUI.page,'string',[num2str(page),'/',num2str(total_page)]);

            end
            show_color(page)
        end
    end

    function delete_pic(~,~)
        control=0;
        set(findobj('Tag','picbagaxes'),...
        'XLim',[0 500],...
        'YLim',[0 500],...
        'Position',[50 30 400 400],...
        'Color',[0.98 0.98 0.98]);
        delete(a);
    end

    function clear_data(~,~)
        control=0;
        set(GUI.text1,'backgroundcolor',[1 1 1]);
        set(GUI.text2,'string','');
        set(findobj('Tag','picbagaxes'),...
        'XLim',[0 500],...
        'YLim',[0 500],...
        'Position',[50 30 400 400],...
        'Color',[0.98 0.98 0.98]);
        set(findobj('tag','recc'),'string','獲取顏色');
        delete(a);
    end

    function get_color(~,~)
        if control==0
            set(GUI.text1,'backgroundcolor',[1 1 1]);
            set(GUI.text2,'string','');
        end
        control=1;
        set(gcf,'WindowButtonMotionFcn',@whilemovefcn)
        set(gcf,'WindowButtonDownFcn',@whileclickfcn)
    end
%%%%%%%%%%%%%%%%%%%%%%%%%%%%%%%%%%%%%%%%%%%%%%%%%%%%%%%%%%%%%%%%%%%%%%%%%%%
    function whilemovefcn(~,~)
        xy=get(gca,'CurrentPoint');
        x=xy(1,2);y=xy(1,1);
        if x<=x_limit&&y<=y_limit&&x>=0&&y>=0
            x(x>x_limit)=x_limit;
            y(y>y_limit)=y_limit;
            x(x<1)=1;
            y(y<1)=1;
            x=round(x);
            y=round(y);
            if control==1
                color=double([ima(x,y,1),ima(x,y,2),ima(x,y,3)]);
                set(GUI.text1,'backgroundcolor',color/255);
                set(GUI.text2,'string',['[',num2str((color/255).*rgb_type+color.*(~rgb_type)),']']);
            end
        else
            if control==1
                set(GUI.text1,'backgroundcolor',[1 1 1]);
                set(GUI.text2,'string','');
            end
        end
    end

    function whileclickfcn(~,~)
            xy=get(gca,'CurrentPoint');
            x=xy(1,2);y=xy(1,1);
            if x<=x_limit&&y<=y_limit&&x>=0&&y>=0
                control=0;
                set(GUI.text1,'backgroundcolor',color/255);
                set(GUI.text2,'string',['[',num2str((color/255).*rgb_type+color.*(~rgb_type)),']']);
                set(findobj('tag','recc'),'string','繼續取色');
                %disp(color/255)
            end
    end
%%%%%%%%%%%%%%%%%%%%%%%%%%%%%%%%%%%%%%%%%%%%%%%%%%%%%%%%%%%%%%%%%%%%%%%%%%%
    function get_capture(~,~)
        screensize=get(0,'screensize');
        screensize=1.5*screensize;
        robot=java.awt.Robot();
        rectangle=java.awt.Rectangle();
        rectangle.x=0;
        rectangle.y=0;
        rectangle.width=screensize(3);
        rectangle.height=screensize(4);
        image=robot.createScreenCapture(rectangle);
        data=image.getData();
        temp=zeros(screensize(3)*screensize(4)*3,1);
        temp=data.getPixels(0,0,screensize(3),screensize(4),temp);
        temp=uint8(temp);
        R=temp(1:3:end);
        G=temp(2:3:end);
        B=temp(3:3:end);
        R=reshape(R,[screensize(3),screensize(4)]);
        G=reshape(G,[screensize(3),screensize(4)]);
        B=reshape(B,[screensize(3),screensize(4)]);
        R=R';
        G=G';
        B=B';
        x_limit=screensize(4);
        y_limit=screensize(3);
        leng=max([x_limit,y_limit]);
        set(findobj('Tag','picbagaxes'),...
        'XLim',[0 leng],...
        'YLim',[0 leng]);
        ima=cat(3,R,G,B);
        delete(a);
        a=imshow(ima);
    end
    function getImage(~,~)
        warning off;
        try
        [filename, pathname] = uigetfile({'*.jpg;*.tif;*.png;*.gif','All Image Files';...
            '*.*','All Files' });
        ima = imread([ pathname,filename]);
        [x,y,~]=size(ima);
        x_limit=x;y_limit=y;
        leng=max([x_limit,y_limit]);
        set(findobj('Tag','picbagaxes'),...
        'XLim',[0 leng],...
        'YLim',[0 leng]);
        delete(a);
        a=imshow(ima);
        catch
        end
    end
end
顏色轉換與色差計算
用 RGB 比較顏色之間的相似度時,存在很大的問題,不建議直接使用,因為往往一個通道的一點改變,會導致最後融合在一起的顏色發生巨大變化,而如果三個通道的同時改變,卻隻會使最後的明暗發生變化,色調並不會產生巨大變化。而這也是H系列色彩空間普遍存在的問題。
所以,經過思考,我決定 RGB 的值轉為 HSV 顏色空間,再進行色差計算。

色差計算,直接利用兩個點的顏色在椎體上的歐式距離,即通過計算如下坐標點的歐式距離。我們通過編寫 color_dist 函數計算。
%計算兩個 HSV 顏色之間的距離
function d = color_dist(color_std,color)
[x0,y0,z0] = getPos(color_std(1),color_std(2),color_std(3));
[x,y,z] = getPos(color(1),color(2),color(3));
d = sqrt((x-x0).^2+(y-y0).^2+(z-z0)^2);
end

function [x,y,z] = getPos(H,S,V)
r = 1;
h = sqrt(3);
x = r*V*S*cos(H);
y = r*V*S*sin(H);
z = h*(1-V);
end

%% 顏色轉為 HSV,再進行色差計算
A2 = rgb2hsv(A);
color2 = rgb2hsv(color);
D = ones(low_num,col_num)*2;
for i=1:low_num
    for j=1:col_num
        D(i,j) = color_dist(color2,A2(i,j,:));
    end
end
mesh(D);
分離曲線
通過調節閾值參數,可以把我們想要的坐標軸過濾掉。閾值越小,過濾效果越明顯。
%% 根據色彩,把想要的曲線分離出來
threshold = 0.5;%可以調整閾值使分離效果變好
I = (D<threshold);
for i=1:3
    RGB= A(:,:,i);
    RGB(~I)=255;
    A3(:,:,i) = RGB;
end
imshow(A3)
二值化,提取數據
二值化圖像是以矩陣形式存儲的。我們根據色素點在矩陣中的位置,利用行列指標和坐標軸的標準化關系,提取數據,重建坐標系。
%% 二值化,提取數據
leftUp = [0,1];%標註截取的圖片的左上角和右下角
rightDown = [1,0];
B = rgb2gray(A3);
imshow(B);
[pos_row,pow_col] = find(B~=255);
Ps = [pos_row-1,pow_col-1];
Ps(:,1) = Ps(:,1)./(low_num-1);
Ps(:,2) = Ps(:,2)./(col_num-1);
x = (rightDown(1)-leftUp(1)).*Ps(:,2)+leftUp(1);
y = leftUp(2)-abs(rightDown(2)-leftUp(2)).*Ps(:,1);
scatter(x,y,0.38);
X = [x,y];

看著八九不離十瞭,但是註意這裡的坐標點是以散點的形式畫出來的。是無序且沒有區分度的,我們甚至無法使用plot。
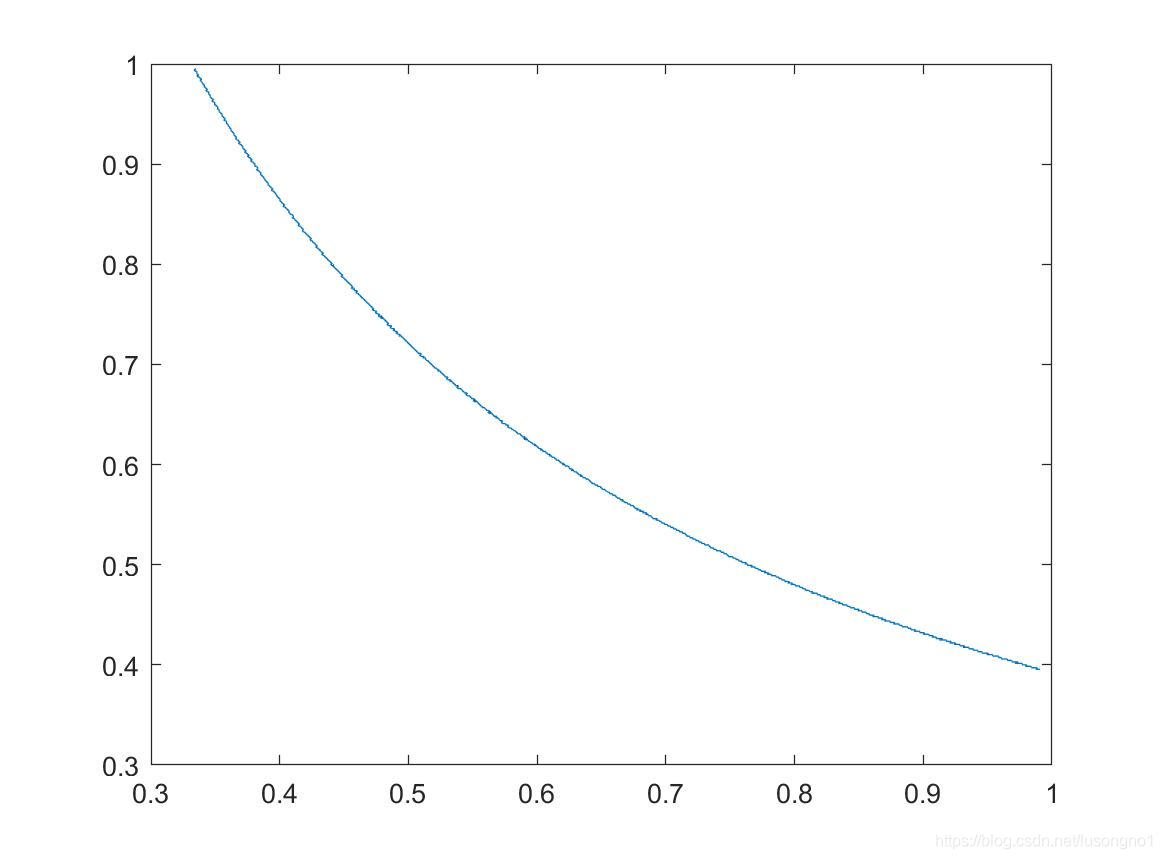
數據點分類與排序
肉眼可見,這幾條曲線是分隔開的。我們如何把這些數據按曲線分開且其上的點按順序排好呢?我的做法是,使用鼠標選中你在意的曲線的一端,利用距離延拓法,還原整條曲線。
%% 數據分類與排序
N = size(X,1);
gfrom = ginput(1);
[~,minI] = min(sum((X - repmat(gfrom,N,1)).^2,2));
from = X(minI,:);
X(minI,:) = [];
X = [from;X];
tol = 0.01;
X1 = findcurvepath(X,tol);
plot(X1(:,1),X1(:,2))
其中用到瞭一個自己寫函數 findcurvepath,它可以從一個數據點出發,把所有的數據點按距離遠近,像串珍珠一樣串在一塊。
function ps1 = findcurvepath(ps0,tol)
%這個函數將點就近連接起來
ps1(1,1:2) = ps0(1,1:2);%將第一個取出來
ps0 = ps0(2:end,:);%ps0重置為剩下的部分
p = ps1(end,:);%p是取出來的最後一個
while ~isempty(ps0)

    i = 1;
    while 1
        distances = p2psdistance(p,ps0);
        inds = find(distances == min(distances));%%%%%%%修復一個bug
        if length(inds) > 1
            if size(ps1,1)<i+1
                break;
            end
            p = ps1(end-i,:);%p是取出來的最後一個
            i = i+1;
        else
            break;
        end
    end

    distances = p2psdistance(p,ps0);
    if min(distances)>tol
        break;
    end
    inds = find(distances == min(distances));%%%%%%%修復一個bug
    ind = inds(1);
    ps1(end+1,1:2) = ps0(ind,1:2);
    ps0(ind,:) = [];
    p = ps1(end,:);
end
end
function distances = p2psdistance(p,ps)
distances = sqrt((p(1)-ps(:,1)).^2+(p(2)-ps(:,2)).^2);
end
後話
我不喜歡做 GUI,因為亂七八糟的界面用起來確實令人心煩。另外一方面,不管是 GUI 或者說進一步的 exe 桌面程序,都依賴於 MATLAB 的環境。也就是說,你要運行代碼,就必須先裝 MATLAB 的環境。試想,一個安裝過和簡單用過 MATLAB 的人,都是有能力可以通過代碼修改一些參數的,那麼你做 GUI 不是畫蛇添足麼。
到此這篇關於利用Matlab提取圖片曲線的文章就介紹到這瞭,更多相關Matlab提取圖片曲線內容請搜索WalkonNet以前的文章或繼續瀏覽下面的相關文章希望大傢以後多多支持WalkonNet!
推薦閱讀:
- 利用Matlab制作一款3D版2048小遊戲
- Android 貝塞爾曲線繪制一個波浪球
- Android顯示富文本+夜間深色模式
- 基於Matlab制作一款簡單的龍舟小遊戲
- 利用Matlab復刻舉牌加油小人生成器