Echarts利用多X軸實現七天天氣預報效果的示例代碼
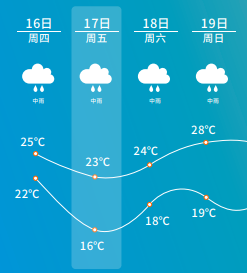
UI設計圖
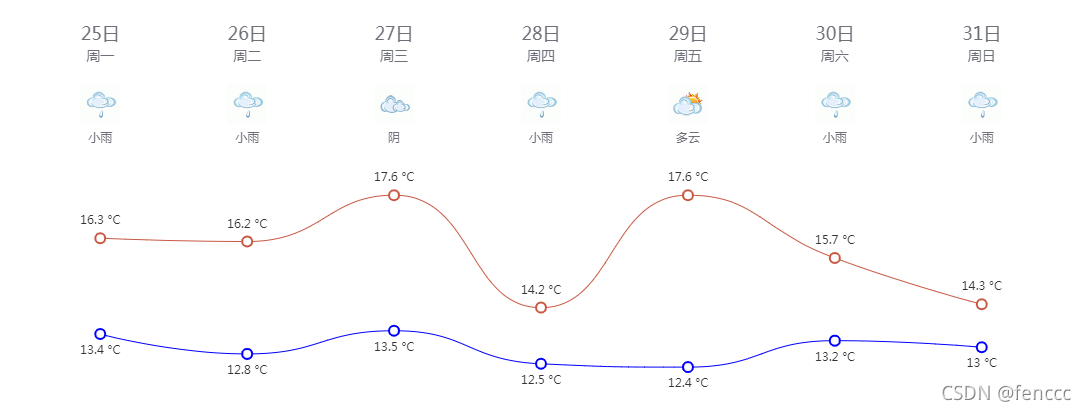
Echarts示例效果
前言
對於UI給出的設計圖,各個氣象網站都有類似的效果,實現方式大可歸為兩種:
- 網格佈局+圖表框架繪制溫度曲線;
- 網格佈局+canvas自繪溫度曲線;
這兩種實現方式的共同點都是將曲線和上面的描述文字拆分開來,這樣做難點是要實現日期圖標部分和氣溫曲線部分的自適應對齊。因為我CSS經驗相對比較薄弱,並且使用Echarts圖表框架相對較多,所以決定嘗試使用Echarts(版本:4.6.0)來實現上面的效果。查看文檔後發現Echarts支持多X軸和富文本顯示,可以通過調整X軸偏移量來控制顯示位置,同時富文本支持設置背景圖標,可以用來顯示天氣圖標。一番測試後得到下面的示例代碼。
示例代碼
下面這段代碼可以考入Echarts直接運行:
var option = {
        grid: {
          show: true,
          backgroundColor: 'transparent',
          opacity: 0.3,
          borderWidth: '0',
          top: '180',
          bottom: '0'
        },
        tooltip: {
          trigger: 'axis'
        },
        legend: {
          show: false
        },
        xAxis: [
          // 日期
          {
            type: 'category',
            boundaryGap: false,
            position: 'top',
            offset: 130,
            zlevel: 100,
            axisLine: {
              show: false
            },
            axisTick: {
              show: false
            },
            axisLabel: {
              interval: 0,
              formatter: [
                '{a|{value}}'
              ].join('\n'),
              rich: {
                a: {
                  // color: 'white',
                  fontSize: 18
                }
              }
            },
            nameTextStyle: {

            },
            data: ["25日","26日","27日","28日","29日","30日","31日"]
          },
          // 星期
          {
            type: 'category',
            boundaryGap: false,
            position: 'top',
            offset: 110,
            zlevel: 100,
            axisLine: {
              show: false
            },
            axisTick: {
              show: false
            },
            axisLabel: {
              interval: 0,
              formatter: [
                '{a|{value}}'
              ].join('\n'),
              rich: {
                a: {
                  // color: 'white',
                  fontSize: 14
                }
              }
            },
            nameTextStyle: {
              fontWeight: 'bold',
              fontSize: 19
            },
            data: ["周一","周二","周三","周四","周五","周六","周日"]
          },
          // 天氣圖標
          {
            type: 'category',
            boundaryGap: false,
            position: 'top',
            offset: 20,
            zlevel: 100,
            axisLine: {
              show: false
            },
            axisTick: {
              show: false
            },
            axisLabel: {
              interval: 0,
              formatter: function(value, index) {
                return '{' + index + '| }\n{b|' + value + '}'
              },
              rich: {
                0: {
                  backgroundColor: {
                    // image: require('@/assets/weather_icon/' + this.weatherIconDic[this.weatherdata.weather[0]] + '.png')
                    image: 'https://d.scggqx.com/forecast/img/小雨.png'
                  },
                  height: 40,
                  width: 40
                },
                1: {
                  backgroundColor: {
                    // image: require('@/assets/weather_icon/' + this.weatherIconDic[this.weatherdata.weather[1]] + '.png')
                    image: 'https://d.scggqx.com/forecast/img/小雨.png'
                  },
                  height: 40,
                  width: 40
                },
                2: {
                  backgroundColor: {
                    // image: require('@/assets/weather_icon/' + this.weatherIconDic[this.weatherdata.weather[2]] + '.png')
                    image: 'https://d.scggqx.com/forecast/img/陰.png'
                  },
                  height: 40,
                  width: 40
                },
                3: {
                  backgroundColor: {
                    // image: require('@/assets/weather_icon/' + this.weatherIconDic[this.weatherdata.weather[3]] + '.png')
                    image: 'https://d.scggqx.com/forecast/img/小雨.png'
                  },
                  height: 40,
                  width: 40
                },
                4: {
                  backgroundColor: {
                    // image: require('@/assets/weather_icon/' + this.weatherIconDic[this.weatherdata.weather[4]] + '.png')
                    image: 'https://d.scggqx.com/forecast/img/多雲.png'
                  },
                  height: 40,
                  width: 40
                },
                5: {
                  backgroundColor: {
                    // image: require('@/assets/weather_icon/' + this.weatherIconDic[this.weatherdata.weather[5]] + '.png')
                    image: 'https://d.scggqx.com/forecast/img/小雨.png'
                  },
                  height: 40,
                  width: 40
                },
                6: {
                  backgroundColor: {
                    // image: require('@/assets/weather_icon/' + this.weatherIconDic[this.weatherdata.weather[6]] + '.png')
                    image: 'https://d.scggqx.com/forecast/img/小雨.png'
                  },
                  height: 40,
                  width: 40
                },
                b: {
                  // color: 'white',
                  fontSize: 12,
                  lineHeight: 30,
                  height: 20
                }
              }
            },
            nameTextStyle: {
              fontWeight: 'bold',
              fontSize: 19
            },
            // data: this.weatherdata.weather
            data: ["小雨","小雨","陰","小雨","多雲","小雨","小雨"]
          }
        ],
        yAxis: {
          type: 'value',
          show: false,
          axisLabel: {
            formatter: '{value} °C',
            color: 'white'
          }
        },
        series: [
          {
            name: '最高氣溫',
            type: 'line',
            data: ["16.3","16.2","17.6","14.2","17.6","15.7","14.3"],
            symbol: 'emptyCircle',
            symbolSize: 10,
            showSymbol: true,
            smooth: true,
            itemStyle: {
              normal: {
                color: '#C95843'
              }
            },
            label: {
              show: true,
              position: 'top',
              // color: 'white',
              formatter: '{c} °C'
            },
            lineStyle: {
              width: 1,
              // color: 'white'
            },
            areaStyle: {
              opacity: 1,
              color: 'transparent'
            }
          },
          {
            name: '最低氣溫',
            type: 'line',
            data: ["13.4","12.8","13.5","12.5","12.4","13.2","13"],
            symbol: 'emptyCircle',
            symbolSize: 10,
            showSymbol: true,
            smooth: true,
            itemStyle: {
              normal: {
                color: 'blue'
              }
            },
            label: {
              show: true,
              position: 'bottom',
              // color: 'white',
              formatter: '{c} °C'
            },
            lineStyle: {
              width: 1,
              // color: 'white'
            },
            areaStyle: {
              opacity: 1,
              color: 'transparent'
            }
          }
        ]
      }
上面的代碼,最難的部分就是天氣圖標的設置,由於axisLabel的formatter方法中的value值沒法在富文本中使用,所以這裡在formatter方法中將value的下標設置成瞭富文本中的css名,然後在設置天氣圖標時使用下標獲取需要顯示的圖標名稱。
// axisLabel的formatter方法
formatter: function(value, index) {
 return '{' + index + '| }\n{b|' + value + '}'
}

// axisLabel的rich方法
rich: {
	index: {
	     backgroundColor: {
	       image: require('@/assets/weather_icon/' + this.weatherIconDic[this.weatherdata.weather[index]] + '.png')
	     },
	     height: 40,
	     width: 40
	   }
   }
註:
1、this.weatherIconDic是我本地定義的一個天氣圖標的數據字典。(如:{ ‘晴’: ‘a00′, ‘多雲’: ‘a01′, ‘陰’: ‘a02′, ‘陣雨’: ‘a03′, ‘雷陣雨’: ‘a04′, ‘冰雹’: ‘a05′, ‘雨夾雪’: ‘a06′, ‘小雨’: ‘a07′, ‘中雨’: ‘a08′, ‘大雨’: ‘a09′, ‘暴雨’: ‘a10′, ‘大暴雨’: ‘a11′, ‘特大暴雨’: ‘a12′, ‘陣雪’: ‘a13′, ‘小雪’: ‘a14′, ‘中雪’: ‘a15′, ‘大雪’: ‘a16′, ‘暴雪’: ‘a17′, ‘霧’: ‘a18′, ‘凍雨’: ‘a19′, ‘沙塵暴’: ‘a20′, ‘小到中雨’: ‘a21′, ‘中雨-大雨’: ‘a22′, ‘大雨-暴雨’: ‘a23′, ‘暴雨-大暴雨’: ‘a24′, ‘大暴雨-特大暴雨’: ‘a25′, ‘小雪-中雪’: ‘a26′, ‘中雪-大雪’: ‘a27′, ‘大雪-暴雪’: ‘a28′, ‘浮塵’: ‘a29′, ‘揚沙’: ‘a30′, ‘強沙塵暴’: ‘a31′ })
2、this.weatherdata.weather是後端傳回來的天氣類型。(如:[“小雨”,“小雨”,“陰”,“小雨”,“多雲”,“小雨”,“小雨”])
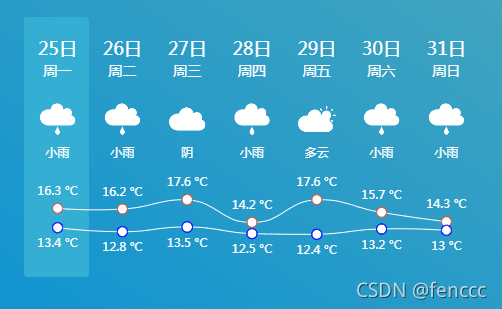
最終效果
到此這篇關於Echarts利用多X軸實現七天天氣預報效果的示例代碼的文章就介紹到這瞭,更多相關Echarts 多X軸天氣預報內容請搜索WalkonNet以前的文章或繼續瀏覽下面的相關文章希望大傢以後多多支持WalkonNet!
推薦閱讀:
- JavaScript可視化與Echarts詳細介紹
- vue使用echarts畫組織結構圖
- vue+echarts實現中國地圖流動效果(步驟詳解)
- Echarts直角坐標系x軸y軸屬性設置整理大全
- Vue導入Echarts實現折線散點圖