python使用reportlab生成pdf實例
Intro
項目中遇到需要 導出統計報表 等業務時,通常需要 pdf 格式。python 中比較有名的就是 reportlab 。
這邊通過幾個小 demo 快速演示常用 api。所有功能點 源碼 都在 使用場景。
一句話瞭解:跟 css 差不多,就是不斷地對每樣東西設置 style,然後把 style 和內容綁定。
功能點
生成
文件: 先 SimpleDocTemplate(‘xxx.pdf’),然後 build
流文件:先 io.BytesIO() 生成句柄,然後同理
曲線圖 LinePlot
餅圖 Pie
文字 Paragraph
fontSize 字體大小 推薦 14
加粗 <b>xxx</b> 使用的是 html 的方式,字體自動實現
firstLineIndent 首行縮進 推薦 2 * fontSize
leading 行間距 推薦 1.5 * fontSize
fontName 默認中文會變成 ■
下載 .ttf 文件 至少2個 【常規】【加粗】
註冊字體 pdfmetrics.registerFont 【常規】請用原名,方便加粗的實現
註冊字體庫 registerFontFamily(“HanSans”, normal=“HanSans”, bold=“HanSans-Bold”)
其他 api 自行摸索,但基本離不開 css 那種理念。官網並沒有常規文檔的那種 md 模式,而是完全寫在瞭 pdf 裡,玩傢需要自己去 pdf 裡像查字典一樣去找。
預覽
完整代碼
import os

from reportlab.graphics.charts.lineplots import LinePlot
from reportlab.graphics.charts.piecharts import Pie
from reportlab.graphics.shapes import Drawing
from reportlab.lib import colors
from reportlab.lib.styles import ParagraphStyle
from reportlab.pdfbase import pdfmetrics
from reportlab.pdfbase.pdfmetrics import registerFontFamily
from reportlab.pdfbase.ttfonts import TTFont
from reportlab.platypus import Paragraph

home = os.path.expanduser("~")

try:
    pdfmetrics.registerFont(TTFont("HanSans", f"{home}/.fonts/SourceHanSansCN-Normal.ttf"))
    pdfmetrics.registerFont(TTFont("HanSans-Bold", f"{home}/.fonts/SourceHanSansCN-Bold.ttf"))
    registerFontFamily("HanSans", normal="HanSans", bold="HanSans-Bold")
    FONT_NAME = "HanSans"
except:
    FONT_NAME = "Helvetica"


class MyCSS:
    h3 = ParagraphStyle(name="h3", fontName=FONT_NAME, fontSize=14, leading=21, alignment=1)
    p = ParagraphStyle(name="p", fontName=FONT_NAME, fontSize=12, leading=18, firstLineIndent=24)


class PiiPdf:
    @classmethod
    def doH3(cls, text: str):
        return Paragraph(text, MyCSS.h3)

    @classmethod
    def doP(cls, text: str):
        return Paragraph(text, MyCSS.p)

    @classmethod
    def doLine(cls):
        drawing = Drawing(500, 220)
        line = LinePlot()
        line.x = 50
        line.y = 50
        line.height = 125
        line.width = 300
        line.lines[0].strokeColor = colors.blue
        line.lines[1].strokeColor = colors.red
        line.lines[2].strokeColor = colors.green
        line.data = [((0, 50), (100, 100), (200, 200), (250, 210), (300, 300), (400, 800))]

        drawing.add(line)
        return drawing

    @classmethod
    def doChart(cls, data):
        drawing = Drawing(width=500, height=200)
        pie = Pie()
        pie.x = 150
        pie.y = 65
        pie.sideLabels = False
        pie.labels = [letter for letter in "abcdefg"]
        pie.data = data  # list(range(15, 105, 15))
        pie.slices.strokeWidth = 0.5

        drawing.add(pie)
        return drawing
使用場景1:生成文件
doc = SimpleDocTemplate("Hello.pdf")
p = PiiPdf()
doc.build([
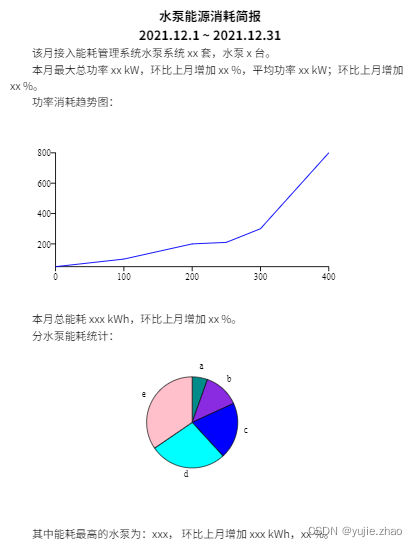
p.doH3("<b>水泵能源消耗簡報</b>"),
p.doH3("<b>2021.12.1 ~ 2021.12.31</b>"),
p.doP("該月接入能耗管理系統水泵系統 xx 套,水泵 x 臺。"),
p.doP("本月最大總功率 xx kW,環比上月增加 xx %,平均功率 xx kW;環比上月增加 xx %。"),
p.doP("功率消耗趨勢圖:"),
p.doLine(),
p.doP("本月總能耗 xxx kWh,環比上月增加 xx %。"),
p.doP("分水泵能耗統計:"),
p.doChart(list(range(15, 105, 20))),
p.doP("其中能耗最高的水泵為:xxx, 環比上月增加 xxx kWh,xx %。"),
])
使用場景2:web(flask)
@Controller.get("/api/pdf")
def api_hub_energy_pdf():
    buffer = io.BytesIO()										# 重點 起一個 io
    doc = SimpleDocTemplate(buffer)

    p = PiiPdf()
    doc.build([
        p.doH3("<b>2021.12.1 ~ 2021.12.31</b>"),
    ])

    buffer.seek(0)
    return Response(											# io 形式返回
        buffer,
        mimetype="application/pdf",
        headers={"Content-disposition": "inline; filename=test.pdf"},
    )
總結
到此這篇關於python使用reportlab生成pdf實例的文章就介紹到這瞭,更多相關python reportlab生成pdf內容請搜索WalkonNet以前的文章或繼續瀏覽下面的相關文章希望大傢以後多多支持WalkonNet!
推薦閱讀:
- Python對PDF文件的常用操作方法詳解
- 2行Python代碼實現給pdf文件添加水印
- Python docx庫刪除復制paragraph及行高設置圖片插入示例
- Graphics2D 寫圖片中文亂碼問題及解決
- C#實現封面圖片生成器的示例代碼