python Pandas時序數據處理
Python中時間的一些常用操作
import time
# 從格林威治時間到現在,單位秒
print('系統時間戳:', time.time())
print('本地時間按格式轉成str:', time.strftime('%Y-%m-%d %X', time.localtime()))
# 無參的localtime返回time.struct_time格式的時間,是本地時區的時間
print('無參localtime:', time.localtime())
print('本時區時間轉成時間戳:', time.mktime(time.localtime()))
# 將時間戳轉換為能讀懂的時間
print('時間戳轉時間:', time.strftime('%Y-%m-%d %X', time.localtime(time.time())))
運行結果:
系統時間戳: 1542188096.1592166
本地時間按格式轉成str: 2018-11-14 17:34:56
無參localtime: time.struct_time(tm_year=2018, tm_mon=11, tm_mday=14, tm_hour=17, tm_min=34, tm_sec=56, tm_wday=2, tm_yday=318, tm_isdst=0)
本時區時間轉成時間戳: 1542188096.0
時間戳轉時間: 2018-11-14 17:34:56
Pandas時間序列(DatetimeIndex)與時序數據
時間序列在Series對象中且作為索引存在時,就構成瞭時序數據。
import datetime
import numpy as np
import pandas as pd
# pd.date_range()函數用於創建一個Pandas時間序列DatetimeIndex
# start參數(也是第一個參數)傳入一個str格式的開始時間,也可以傳入一個datetime對象
# 這裡用datetime.datetime()創建瞭一個datetime對象,隻用瞭前三個參數也就是年月日
# pd.date_range()函數可以指明end表示時間序列的結尾時間
# 這裡用periods參數指明序列中要生成的時間的個數,freq='D'指定為每天(Day)生成一個時間
dti = pd.date_range(start=datetime.datetime(2018, 11, 14), periods=18, freq='D')
print(dti, '\n', '*' * 40, sep='')
# 將時間序列放在Series對象中作為索引,這裡freq='W'表示隔一周生成一個
s_dti = pd.Series(np.arange(6), index=pd.date_range('2018/11/4', periods=6, freq='W'))
print(s_dti.head(), '\n', '*' * 40, sep='')
# 取時序數據中指定時間的內容
print(s_dti['2018-11-25'], '\n', '*' * 40, sep='')
# 取第二個索引對應的時間的年月日
print(s_dti.index[2].year, s_dti.index[2].month, s_dti.index[2].day, '\n', '*' * 40, sep='')
運行結果:
DatetimeIndex(['2018-11-14', '2018-11-15', '2018-11-16', '2018-11-17',
'2018-11-18', '2018-11-19', '2018-11-20', '2018-11-21',
'2018-11-22', '2018-11-23', '2018-11-24', '2018-11-25',
'2018-11-26', '2018-11-27', '2018-11-28', '2018-11-29',
'2018-11-30', '2018-12-01'],
dtype='datetime64[ns]', freq='D')
****************************************
2018-11-04 0
2018-11-11 1
2018-11-18 2
2018-11-25 3
2018-12-02 4
Freq: W-SUN, dtype: int32
****************************************
3
****************************************
20181118
****************************************
杭州天氣的時序處理
import pandas as pd
import matplotlib as mpl
import matplotlib.pyplot as plt
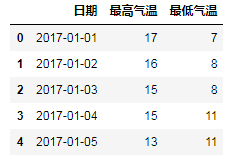
df = pd.read_csv('E:/Data/practice/hz_weather.csv')
df = df[['日期', '最高氣溫', '最低氣溫']]
# print(df.head())

print(type(df.日期))  # <class 'pandas.core.series.Series'>
print(type(df.日期.values))  # <class 'numpy.ndarray'>

# 修改日期格式
# 註意,df.日期得到的是Series對象,df.日期.values得到的是ndarray多維數組
# pd.to_datetime()函數將輸入解析成時間對象的格式並返回
# format參數指定解析的方式
# 當輸入列表形式的值時,返回DatetimeIndex;當輸入Series時,返回Series;當輸入常量時,返回Timestamp
print(type(pd.to_datetime(df.日期.values, format="%Y-%m-%d")))  # <class 'pandas.core.indexes.datetimes.DatetimeIndex'>
print(type(pd.to_datetime(df.日期, format="%Y-%m-%d")))  # <class 'pandas.core.series.Series'>
df.日期 = pd.to_datetime(df.日期.values, format="%Y-%m-%d")
# print(df.head())
# 將日期設置為索引
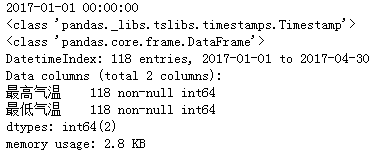
df = df.set_index('日期')
# 取出第0個索引值對應的日期
print(df.index[0]) # 2017-01-01 00:00:00
# DatetimeIndex裡存的是一個個的Timestamp,查看一下類型
print(type(df.index[0])) # <class 'pandas._libs.tslibs.timestamps.Timestamp'>
# print(df.info())
# 提取1月份的溫度數據
df_jan = df[(df.index >= "2017-1-1") & (df.index < "2017-2-1")]
# 或用這種方式也可以
df_jan = df["2017-1-1":"2017-1-31"]
# print(df_jan.info())

# 隻取到月份
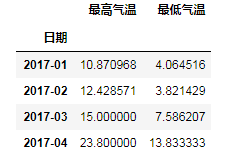
df_m = df.to_period('M')
# print(df_m.head())

# 利用上面的隻取到月份,對level=0(即索引層級)做聚合就可以求月內的平均值等
s_m_mean = df_m.groupby(level=0).mean()
# print(s_m_mean.head())
# 繪制[最高溫度]和[最低溫度]兩個指標隨著索引[時間]變化的圖
fig, ax = plt.subplots(1, 1, figsize=(12, 4))
df.plot(ax=ax)
plt.show()

附:matplotlib中文支持

到此這篇關於python Pandas時序數據處理 的文章就介紹到這瞭,更多相關Pandas 時序數據 內容請搜索WalkonNet以前的文章或繼續瀏覽下面的相關文章希望大傢以後多多支持WalkonNet!
推薦閱讀:
- Pandas如何將Timestamp轉為datetime類型
- pandas實現datetime64與unix時間戳互轉
- Python Pandas高級教程之時間處理
- Python中的pandas表格模塊、文件模塊和數據庫模塊
- Python pandas索引的設置和修改方法