Python實現DBSCAN聚類算法並樣例測試
什麼是聚類算法
聚類是一種機器學習技術,它涉及到數據點的分組。給定一組數據點,我們可以使用聚類算法將每個數據點劃分為一個特定的組。理論上,同一組中的數據點應該具有相似的屬性和/或特征,而不同組中的數據點應該具有高度不同的屬性和/或特征。聚類是一種無監督學習的方法,是許多領域中常用的統計數據分析技術。
常用的算法包括K-MEANS、高斯混合模型(Gaussian Mixed Model,GMM)、自組織映射神經網絡(Self-Organizing Map,SOM)
重點給大傢介紹Python實現DBSCAN聚類算法並通過簡單樣例測試。
發現高密度的核心樣品並從中膨脹團簇。
Python代碼如下:
# -*- coding: utf-8 -*-
"""
Demo of DBSCAN clustering algorithm
Finds core samples of high density and expands clusters from them.
"""
print(__doc__)
# 引入相關包
import numpy as np
from sklearn.cluster import DBSCAN
from sklearn import metrics
from sklearn.datasets.samples_generator import make_blobs
from sklearn.preprocessing import StandardScaler
import matplotlib.pyplot as plt
# 初始化樣本數據
centers = [[1, 1], [-1, -1], [1, -1]]
X, labels_true = make_blobs(n_samples=750, centers=centers, cluster_std=0.4,
random_state=0)
X = StandardScaler().fit_transform(X)
# 計算DBSCAN
db = DBSCAN(eps=0.3, min_samples=10).fit(X)
core_samples_mask = np.zeros_like(db.labels_, dtype=bool)
core_samples_mask[db.core_sample_indices_] = True
labels = db.labels_
# 聚類的結果
n_clusters_ = len(set(labels)) - (1 if -1 in labels else 0)
n_noise_ = list(labels).count(-1)
print('Estimated number of clusters: %d' % n_clusters_)
print('Estimated number of noise points: %d' % n_noise_)
print("Homogeneity: %0.3f" % metrics.homogeneity_score(labels_true, labels))
print("Completeness: %0.3f" % metrics.completeness_score(labels_true, labels))
print("V-measure: %0.3f" % metrics.v_measure_score(labels_true, labels))
print("Adjusted Rand Index: %0.3f"
% metrics.adjusted_rand_score(labels_true, labels))
print("Adjusted Mutual Information: %0.3f"
% metrics.adjusted_mutual_info_score(labels_true, labels,
average_method='arithmetic'))
print("Silhouette Coefficient: %0.3f"
% metrics.silhouette_score(X, labels))
# 繪出結果
unique_labels = set(labels)
colors = [plt.cm.Spectral(each)
for each in np.linspace(0, 1, len(unique_labels))]
for k, col in zip(unique_labels, colors):
if k == -1:
col = [0, 0, 0, 1]
class_member_mask = (labels == k)
xy = X[class_member_mask & core_samples_mask]
plt.plot(xy[:, 0], xy[:, 1], 'o', markerfacecolor=tuple(col),
markeredgecolor='k', markersize=14)
xy = X[class_member_mask & ~core_samples_mask]
plt.plot(xy[:, 0], xy[:, 1], 'o', markerfacecolor=tuple(col),
markeredgecolor='k', markersize=6)
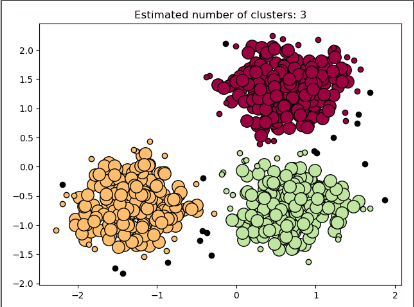
plt.title('Estimated number of clusters: %d' % n_clusters_)
plt.show()
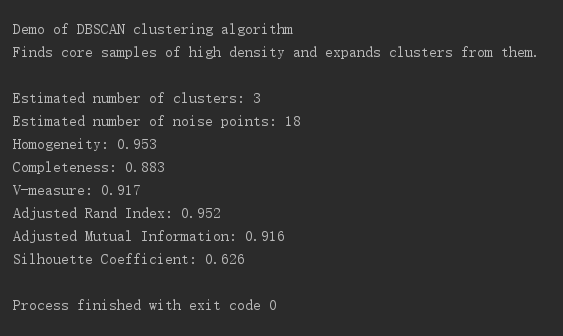
測試結果如下:
最終結果繪圖:
具體數據:
以上就是Python實現DBSCAN聚類算法(簡單樣例測試)的詳細內容,更多關於Python聚類算法的資料請關註WalkonNet其它相關文章!
推薦閱讀:
- 分析總結Python數據化運營KMeans聚類
- python中k-means和k-means++原理及實現
- 淺析python常用數據文件處理方法
- Pytorch訓練模型得到輸出後計算F1-Score 和AUC的操作
- 人工智能——K-Means聚類算法及Python實現