Echarts實例教程之樹形圖表的實現方法
樹圖主要用來可視化樹形數據結構,是一種特殊的層次類型。
實現方法,將series->type設置為tree。
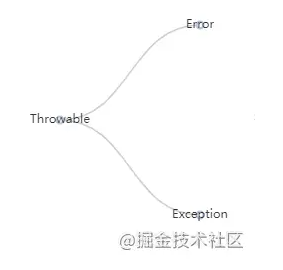
Echarts的樹形圖表,可以是正交的,也可以是徑向的。
正交樹:
徑向樹:
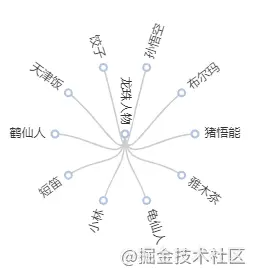
實現方法,修改:series->layout設置,orthogonal為正向,radial為徑向。
可以自定義,如從右向左:
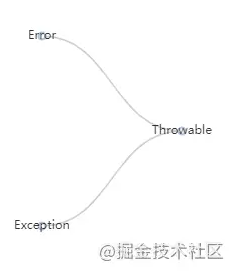
實現方法,修改:series->orient設置,支持LR、RL、TB、BT,其中RL,就是從右向左。
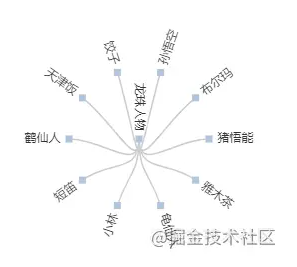
可以自定義圖標:支持’circle’, ‘rect’, ’roundRect’, ‘triangle’, ‘diamond’, ‘pin’, ‘arrow’, ‘none’
實現方法,修改:series->symbol設置
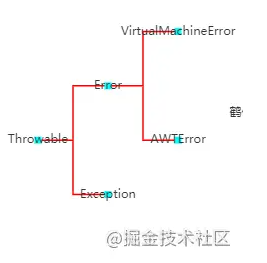
圖標是方形的樹形圖表:
可以自定義,直線還是曲線:
實現方法,修改:series->edgeShape設置,支持curve 和 polyline
直線圖表:
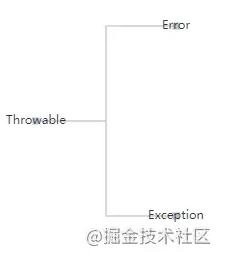
initialTreeDepth:
默認展開的深度,默認為2,多於2層的的節點可以點擊父節點來展示和隱藏。如果設置為 -1 或者 null 或者 undefined,所有節點都將展開。
itemStyle:
修改樹形圖表項的樣式。
可以修改顏色、大小等
label:
圖表項中文字的處理。
可以通過formatter來給圖表的文字增加豐富的效果。
lineStyle:
圖表中線的處理。
修改lineStyle樣式的效果:
emphasis: 聚焦,設置瞭聚焦後,鼠標放到項,其他無關項就會暫時隱藏。
‘none’ 不淡出其它圖形,默認使用該配置。
‘self’ 隻聚焦(不淡出)當前高亮的數據的圖形。
‘series’ 聚焦當前高亮的數據所在的系列的所有圖形。
‘ancestor’ 聚焦所有祖先節點
‘descendant’ 聚焦所有子孫節點
emphasis: {
    focus: 'ancestor',
    blurScope: 'coordinateSystem'
}
樹形圖表的數據結構:
name: 圖表項默認項顯示的名稱
children: 這個項的子節點
當然,你在數據裡可以定義任意屬性,如value、num等,可以配合label中的formatter來實現更加豐富的顯示效果。
最後是完整的代碼:
index.html
<!DOCTYPE html>
<html lang="en">

<head>
    <meta charset="UTF-8">
    <meta http-equiv="X-UA-Compatible" content="IE=edge">
    <meta name="viewport" content="width=device-width, initial-scale=1.0">
    <title>Echarts實例 - 圖例</title>
    <script src="../../echarts.js"></script>
</head>

<body>
    <div id="container" style="width: 500px;height:500px;">

    </div>
    <script src="./index.js"></script>
</body>

</html>
index.js
var chart = echarts.init(document.getElementById("container"));

var data = {
    name: 'Throwable',
    children: [{
        name: 'Error',
        children: [{
            name: 'VirtualMachineError',
            children: [{
                name: 'StackOverflowError'
            }, {
                name: 'OutOfMemoryError'
            }]
        }, {
            name: 'AWTError'
        }]
    }, {
        name: 'Exception'
    }]
}


var data2 = {
    name: '龍珠人物',
    children: [{
        name: '孫悟空'
    }, {
        name: '佈爾瑪'
    }, {
        name: '豬悟能'
    }, {
        name: '雅木茶'
    }, {
        name: '龜仙人'
    }, {
        name: '小林'
    }, {
        name: '短笛'
    }, {
        name: '鶴仙人'
    }, {
        name: '天津飯'
    }, {
        name: '餃子'
    }]
}

chart.setOption({
    title: {
        text: 'Java異常結構圖'
    },
    series: [{
        layout: 'orthogonal',
        data: [data],
        right: '60%',
        type: 'tree',
        edgeShape: 'polyline', // curve 和 polyline
        symbol: 'rect', // 'circle', 'rect', 'roundRect', 'triangle', 'diamond', 'pin', 'arrow', 'none',
        initialTreeDepth: 2,
        itemStyle: {
            color: 'cyan'
        },
        lineStyle: {
            color: 'red'
        },
        /**
         *
         *
         * 'none' 不淡出其它圖形,默認使用該配置。
'self' 隻聚焦(不淡出)當前高亮的數據的圖形。

'series' 聚焦當前高亮的數據所在的系列的所有圖形。

'ancestor' 聚焦所有祖先節點
'descendant' 聚焦所有子孫節點
         */
        emphasis: {
            focus: 'ancestor',
            blurScope: 'coordinateSystem'
        },
    }, {
        layout: 'radial',
        left: '60%',
        data: [data2],
        type: 'tree',
        symbol: 'rect',
        symbolSize: 15
    }]
})
總結
到此這篇關於Echarts實例教程之樹形圖表實現的文章就介紹到這瞭,更多相關Echarts實現樹形圖表內容請搜索WalkonNet以前的文章或繼續瀏覽下面的相關文章希望大傢以後多多支持WalkonNet!