Python使用bar繪制堆積/帶誤差棒柱形圖的實現
本博文源於《python數據可視化》(黑馬程序員編著)。先講解bar參數如何使用,然後分別演示堆積柱形圖和帶誤差柱形圖畫法。
bar參數
bar(x,height,width=0.8,bottom=None,align='center',data=None,
tick_label=None,xerr=None,yerr=None,error_kw=None,**kwargs)
該函數常用參數如下:
- x 表示x的坐標值
- height:表示柱形的高度
- width:表示柱形的寬度,默認為0.8
- bottom:表示柱形底部的y坐標值,默認為0
- align:表示柱形的對齊方式,有’center’和’edge’兩個取值,其中’center’表示將柱形與刻度線居中對齊,’edge’表示將柱形的左邊與刻度線對齊
- tick_label:表示柱形對應的刻度標簽
- xerr,yerr:若未設為None,則需要為柱形圖添加水平/垂直誤差棒
- error_kw:表示誤差棒的屬性字典,字典的鍵對應errorbar()函數的關鍵字參數.
示例:堆積柱形圖演示
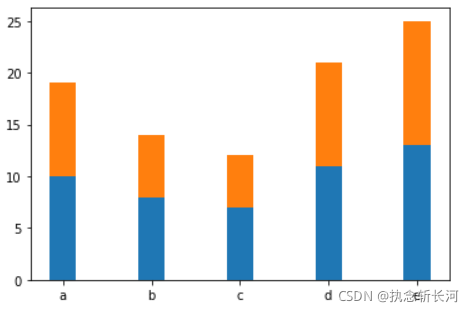
import matplotlib.pyplot as plt
import numpy as np
x = np.arange(5)
y1 = np.array([10,8,7,11,13])
y2 = np.array([9,6,5,10,12])
plt.bar(x,y1,tick_label=['a','b','c','d','e'],width=bar_width)
plt.bar(x,y2,bottom=y1,width=bar_width)
plt.show()
示例:帶有誤差棒的堆積圖

    import matplotlib.pyplot as plt
    import numpy as np

    x = np.arange(5)
    y1 = np.array([10, 8, 7, 11, 13])
    error = [2, 1, 2.5, 2, 1.5]
    bar_width = 0.3
    # 繪制帶有誤差棒的柱形圖
    plt.bar(x, y1, tick_label=['a', 'b', 'c', 'd', 'e'], width=bar_width)
    plt.bar(x, y1, bottom=y1, width=bar_width, yerr=error)
    plt.show()
到此這篇關於Python使用bar繪制堆積/帶誤差棒柱形圖的實現的文章就介紹到這瞭,更多相關Python bar柱形圖內容請搜索WalkonNet以前的文章或繼續瀏覽下面的相關文章希望大傢以後多多支持WalkonNet!
推薦閱讀:
- python數學建模之Matplotlib 實現圖片繪制
- python繪制堆疊條形圖介紹
- Python數據分析Matplotlib 柱狀圖繪制
- Python數據分析之Matplotlib數據可視化
- Python使用matplotlib給柱狀圖添加數據標簽bar_label()