Python+OpenCV實戰之利用 K-Means 聚類進行色彩量化
前言
K-Means 聚類算法的目標是將 n 個樣本劃分(聚類)為 K 個簇,在博文《OpenCV與機器學習的碰撞》中,我們已經學習利用 OpenCV 提供瞭 cv2.kmeans() 函數實現 K-Means 聚類算法,該算法通過找到簇的中心並將輸入樣本分組到簇周圍,同時通過簡單的示例瞭解瞭 K-Means 算法的用法。在本文中,我們將學習如何利用 K-Means 聚類進行色彩量化,以減少圖像中顏色數量。
利用 K-Means 聚類進行色彩量化
色彩量化問題可以定義為減少圖像中顏色數量的過程。色彩量化對於某些設備顯示圖像非常關鍵,這些設備可能由於內存限制等原因隻能顯示有限顏色,因此,在這些設備上顯示色彩通常需要在準確性和減少顏色數量之間進行權衡,在利用 K-Means 聚類進行色彩量化時,權衡兩者是通過正確設置 K 參數來進行的。
利用 K-Means 聚類算法來執行色彩量化,簇中心數據由 3 個特征組成,它們對應於圖像每個像素的 B、G 和 R 值。因此,關鍵是將圖像轉換為數據:
data = np.float32(image).reshape((-1, 3))
為瞭觀察如何權衡準確性和顏色數,我們使用不同 K 值 (3 、 5 、 10 、 20 和 40) 執行聚類過程,以查看生成的圖像如何變化,如果我們想要隻有 3 種顏色 (K = 3) 的結果圖像,需要執行以下操作:
加載 BGR 圖像:
img = cv2.imread('example.jpg')
使用 color_quantization() 函數執行色彩量化:
def color_quantization(image, k):
    # 將圖像轉換為數據
    data = np.float32(image).reshape((-1, 3))
    # 算法終止條件
    criteria = (cv2.TERM_CRITERIA_EPS + cv2.TERM_CRITERIA_MAX_ITER, 20, 1.0)
    # K-Means 聚類
    ret, label, center = cv2.kmeans(data, k, None, criteria, 10, cv2.KMEANS_RANDOM_CENTERS)
    # 簇中心
    center = np.uint8(center)
    # 將具有 k 顏色中心的圖像轉換為 uint8
    result = center[label.flatten()]
    result = result.reshape(img.shape)
    return result
color_3 = color_quantization(img, 3)
color_quantization() 函數中,關鍵點是利用 cv2.kmeans() 方法。最後,可以用 k 種顏色來構建圖像,用它們對應的中心值替換每個像素值,程序的運行結果如下所示:


完整代碼
利用 K-Means 聚類進行色彩量化的完整代碼如下所示:
import numpy as np
import cv2
from matplotlib import pyplot as plt


def show_img_with_matplotlib(color_img, title, pos):
    img_RGB = color_img[:, :, ::-1]

    ax = plt.subplot(2, 4, pos)
    plt.imshow(img_RGB)
    plt.title(title, fontsize=8)
    plt.axis('off')

def color_quantization(image, k):
    # 將圖像轉換為數據
    data = np.float32(image).reshape((-1, 3))
    # 算法終止條件
    criteria = (cv2.TERM_CRITERIA_EPS + cv2.TERM_CRITERIA_MAX_ITER, 20, 1.0)
    # K-Means 聚類
    ret, label, center = cv2.kmeans(data, k, None, criteria, 10, cv2.KMEANS_RANDOM_CENTERS)
    # 簇中心
    center = np.uint8(center)
    # 將具有 k 顏色中心的圖像轉換為 uint8
    result = center[label.flatten()]
    result = result.reshape(img.shape)
    return result

fig = plt.figure(figsize=(16, 8))
plt.suptitle("Color quantization using K-means clustering algorithm", fontsize=14, fontweight='bold')
# 圖片加載
img = cv2.imread('example.png')
show_img_with_matplotlib(img, "original image", 1)
# 使用不同 K 值進行色彩量化
for i in range(7):
    color = color_quantization(img, (i+1) * 10)
    show_img_with_matplotlib(color, "color quantization (k = {})".format((i+1) * 10), i+2)

plt.show()
顯示色彩量化後的色彩分佈
可以擴展以上程序使其顯示色彩量化後的色彩分佈,該色彩分佈顯示瞭分配給每個聚類中心的像素數。隻需擴展 color_quantization() 函數已被修改為包含所需功能:
import collections
def color_quantization(image, k):
    # 將圖像轉換為數據
    data = np.float32(image).reshape((-1, 3))
    # 算法終止條件
    criteria = (cv2.TERM_CRITERIA_EPS + cv2.TERM_CRITERIA_MAX_ITER, 20, 1.0)
    # K-Means 聚類
    ret, label, center = cv2.kmeans(data, k, None, criteria, 10, cv2.KMEANS_RANDOM_CENTERS)
    # 簇中心
    center = np.uint8(center)
    # 將具有 k 顏色中心的圖像轉換為 uint8
    result = center[label.flatten()]
    result = result.reshape(img.shape)
    # 統計分配給每個聚類中心的像素數
    counter = collections.Counter(label.flatten())
    print(counter)
    # 計算輸入圖像的總像素數
    total = img.shape[0] * img.shape[1]
    # 為色彩分佈圖像指定寬度和高度:
    desired_width = img.shape[1]

    desired_height = 70
    desired_height_colors = 50
    # 初始化色彩分佈圖像
    color_distribution = np.ones((desired_height, desired_width, 3), dtype='uint8') * 255
    start = 0

    for key, value in counter.items():
        # 歸一化
        value_normalized = value / total * desired_width
        end = start + value_normalized
        # 繪制與當前顏色對應的矩形
        cv2.rectangle(color_distribution, (int(start), 0), (int(end), desired_height_colors), center[key].tolist(), -1)
        start = end

    return np.vstack((color_distribution, result))
上述代碼中,使用 collections.Counter() 來統計分配給每個聚類中心的像素數:
counter = collections.Counter(label.flatten())
例如,如果 K = 10,則可以得到如下結果:
Counter({7: 37199, 3: 36302, 0: 29299, 5: 23987, 6: 23895, 1: 20077, 9: 19814, 8: 18427, 4: 16221, 2: 14779})
構建色彩分佈圖像後,將其與色彩量化後的圖像連接在一起:
np.vstack((color_distribution, result))
程序的輸出如下所示:
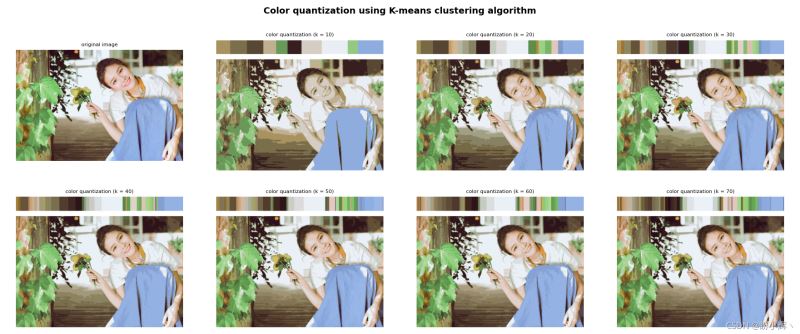
從上圖可以看出,使用 K-Means 聚類算法應用色彩量化後改變參數 k (10、20、30、40、50、60 和 70) 的結果,k 值越大產生的圖像越逼真。
Note:除瞭 color_quantization() 函數外,由於其他代碼並未修改,因此不再另外給出。
到此這篇關於Python+OpenCV實戰之利用 K-Means 聚類進行色彩量化的文章就介紹到這瞭,更多相關OpenCV K-Means 內容請搜索WalkonNet以前的文章或繼續瀏覽下面的相關文章希望大傢以後多多支持WalkonNet!
推薦閱讀:
- Python OpenCV實戰之與機器學習的碰撞
- tensorflow+k-means聚類簡單實現貓狗圖像分類的方法
- Python sklearn中的K-Means聚類使用方法淺析
- python中k-means和k-means++原理及實現
- Python K-means實現簡單圖像聚類的示例代碼