Python爬取當網書籍數據並數據可視化展示
一、開發環境
- Python 3.8
- Pycharm 2021.2 專業版
二、模塊使用
csv 模塊 把爬取下來的數據保存表格裡面的 內置模塊requests >>> pip install requests 數據請求模塊parsel >>> pip install parsel 數據解析模塊 css選擇器去提取數據
三、爬蟲代碼實現步驟
- 導入所需模塊
- 發送請求, 用
python代碼模擬瀏覽器發送請求 - 解析數據, 提取我們想要數據內容
- 多頁爬取
- 保存數據, 保存
csv表格裡面
1. 導入所需模塊
import requests  # 數據請求模塊 第三方模塊 需要 pip install requests
import parsel  # 數據解析模塊 第三方模塊 需要 pip install parsel
import csv  # 保存csv表格數據模塊 內置模塊
import time  # 時間模塊
2. 發送請求, 用python代碼模擬瀏覽器發送請求
headers 請求頭 作用就是python代碼偽裝成瀏覽器 對於服務器發送請求
User-Agent 用戶代理 瀏覽器的基本身份標識
標題中無效的返回字符或前導空格:User-Agent 不要留有空格
通過requests模塊裡面get請求方法,對於url地址發送請求,並且攜帶上面header請求頭參數,最後用response變量接收返回數據
url = f'http://bang.dangdang.com/books/bestsellers/01.00.00.00.00.00-24hours-0-0-1-{page}'
# headers 請求頭 字典數據類型
headers = {
    'User-Agent': 'Mozilla/5.0 (Windows NT 10.0; Win64; x64) AppleWebKit/537.36 (KHTML, like Gecko) Chrome/96.0.4664.45 Safari/537.36'
}
response = requests.get(url=url, headers=headers)
3. 解析數據, 提取我們想要數據內容
selector = parsel.Selector(response.text) # 對於獲取到的html字符串數據進行轉換 selector 對象
# css選擇器 就是根據標簽屬性提取相應的數據
lis = selector.css('ul.bang_list li')
for li in lis:
# .name 定位 class類名name標簽 a 標簽 attr() 屬性選擇器 取a標簽裡面title屬性 get() 獲取數據
title = li.css('.name a::attr(title)').get() # 書名
# 獲取標簽裡面文本數據 直接text
comment = li.css('.star a::text').get().replace('條評論', '') # 評論
recommend = li.css('.star .tuijian::text').get().replace('推薦', '') # 推薦
author = li.css('.publisher_info a:nth-child(1)::attr(title)').get() # 作者
publish = li.css('div:nth-child(6) a::text').get() # 出版社
price_n = li.css('.price .price_n::text').get() # 售價
price_r = li.css('.price .price_r::text').get() # 原價
price_s = li.css('.price .price_s::text').get() # 折扣
price_e = li.css('.price .price_e .price_n::text').get() # 電子書價格
href = li.css('.name a::attr(href)').get() # 詳情頁
dit = {
'書名': title,
'評論數': comment,
'推薦量': recommend,
'作者': author,
'出版社': publish,
'售價': price_n,
'原價': price_r,
'折扣': price_s,
'電子書價格': price_e,
'詳情頁': href,
}
csv_writer.writerow(dit) # 數據保存到csv
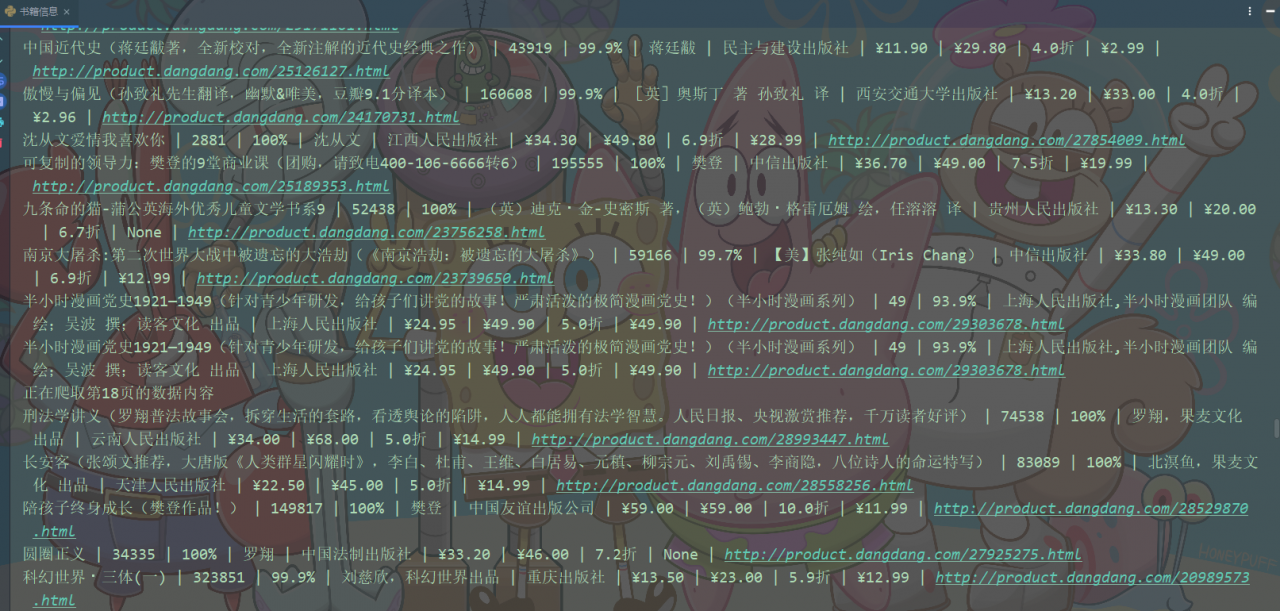
print(title, comment, recommend, author, publish, price_n, price_r, price_s, price_e, href, sep=' | ')
4. 多頁爬取
for page in range(1, 26):
    # 字符串格式化方法
    print(f'正在爬取第{page}頁的數據內容')
    time.sleep(1.5)
    url = f'http://bang.dangdang.com/books/bestsellers/01.00.00.00.00.00-24hours-0-0-1-{page}'
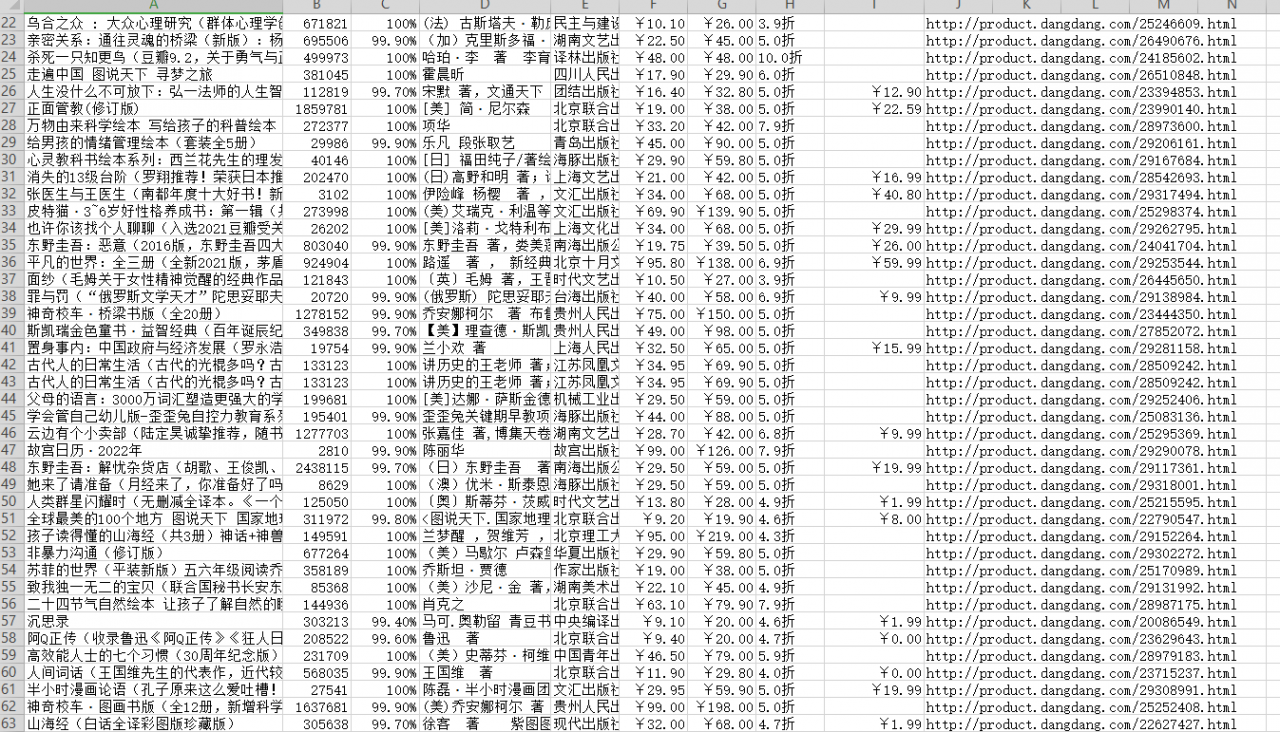
5. 保存數據, 保存csv表格裡面
# 創建打開一個文件 進行保存
f = open('當當圖書.csv', mode='a', encoding='utf-8', newline='')
csv_writer = csv.DictWriter(f, fieldnames=[
    '書名',
    '評論數',
    '推薦量',
    '作者',
    '出版社',
    '售價',
    '原價',
    '折扣',
    '電子書價格',
    '詳情頁',
])
csv_writer.writeheader()  # 寫入表頭
運行代碼,效果如下圖:
四、數據可視化
1.導入所需模塊
import pandas as pd
from pyecharts.charts import *
from pyecharts.globals import ThemeType#設定主題
from pyecharts.commons.utils import JsCode
import pyecharts.options as opts
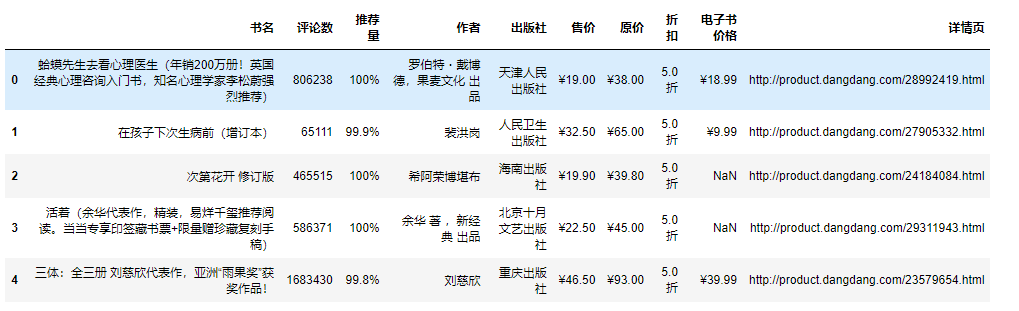
2.導入數據
df = pd.read_csv('書籍信息.csv', encoding='utf-8', engine='python')
df.head()
3.可視化
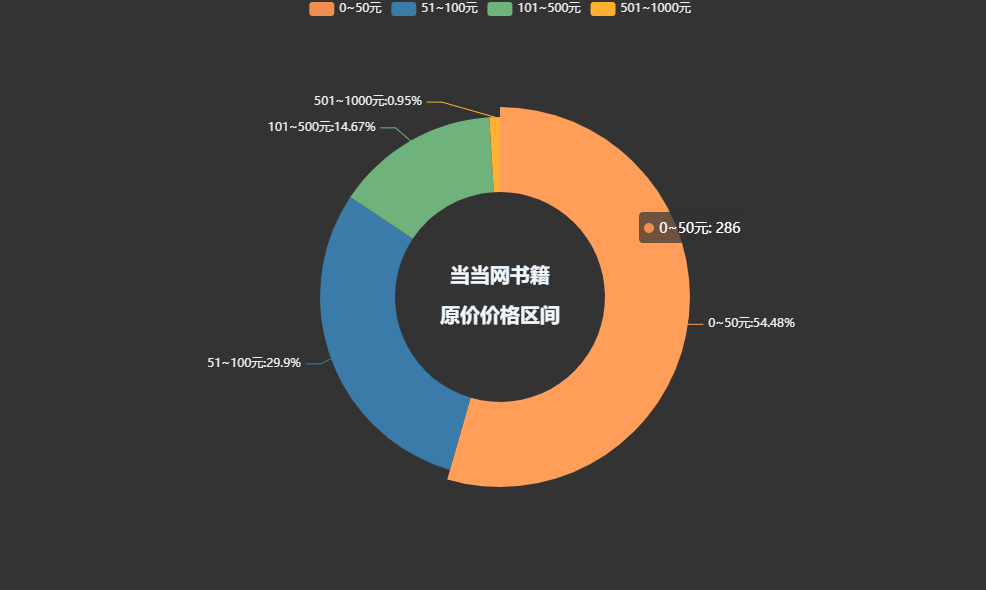
書籍總體價格區間:
pie1 = (
    Pie(init_opts=opts.InitOpts(theme='dark',width='1000px',height='600px'))

    .add('', datas_pair_1, radius=['35%', '60%'])
    .set_series_opts(label_opts=opts.LabelOpts(formatter="{b}:{d}%"))
    .set_global_opts(
        title_opts=opts.TitleOpts(
            title="當當網書籍\n\n原價價格區間",
            pos_left='center',
            pos_top='center',
            title_textstyle_opts=opts.TextStyleOpts(
                color='#F0F8FF',
                font_size=20,
                font_weight='bold'
            ),
        )
    )
    .set_colors(['#EF9050', '#3B7BA9', '#6FB27C', '#FFAF34', '#D8BFD8', '#00BFFF', '#7FFFAA'])
)
pie1.render_notebook()
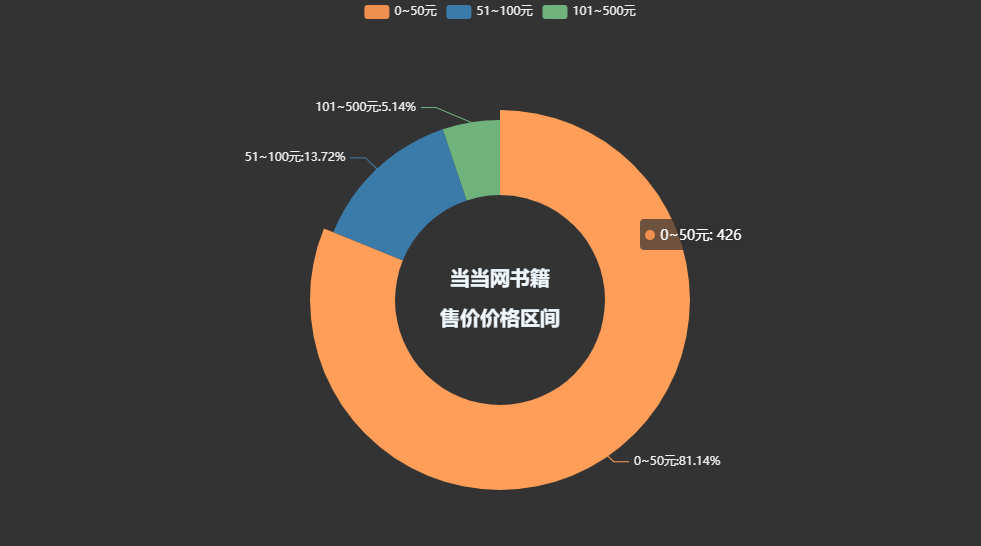
pie1 = (
    Pie(init_opts=opts.InitOpts(theme='dark',width='1000px',height='600px'))

    .add('', datas_pair_2, radius=['35%', '60%'])
    .set_series_opts(label_opts=opts.LabelOpts(formatter="{b}:{d}%"))
    .set_global_opts(
        title_opts=opts.TitleOpts(
            title="當當網書籍\n\n售價價格區間",
            pos_left='center',
            pos_top='center',
            title_textstyle_opts=opts.TextStyleOpts(
                color='#F0F8FF',
                font_size=20,
                font_weight='bold'
            ),
        )
    )
    .set_colors(['#EF9050', '#3B7BA9', '#6FB27C', '#FFAF34', '#D8BFD8', '#00BFFF', '#7FFFAA'])
)
pie1.render_notebook()
各個出版社書籍數量柱狀圖:
bar=(
    Bar(init_opts=opts.InitOpts(height='500px',width='1000px',theme='dark'))
    .add_xaxis(counts.index.tolist())
    .add_yaxis(
        '出版社書籍數量',
        counts.values.tolist(),
        label_opts=opts.LabelOpts(is_show=True,position='top'),
        itemstyle_opts=opts.ItemStyleOpts(
            color=JsCode("""new echarts.graphic.LinearGradient(
            0, 0, 0, 1,[{offset: 0,color: 'rgb(255,99,71)'}, {offset: 1,color: 'rgb(32,178,170)'}])
            """
            )
        )
    )
    .set_global_opts(
        title_opts=opts.TitleOpts(
            title='各個出版社書籍數量柱狀圖'),
            xaxis_opts=opts.AxisOpts(name='書籍名稱',
            type_='category',
            axislabel_opts=opts.LabelOpts(rotate=90),
        ),
        yaxis_opts=opts.AxisOpts(
            name='數量',
            min_=0,
            max_=29.0,
            splitline_opts=opts.SplitLineOpts(is_show=True,linestyle_opts=opts.LineStyleOpts(type_='dash'))
        ),
        tooltip_opts=opts.TooltipOpts(trigger='axis',axis_pointer_type='cross')
    )

    .set_series_opts(
        markline_opts=opts.MarkLineOpts(
            data=[
                opts.MarkLineItem(type_='average',name='均值'),
                opts.MarkLineItem(type_='max',name='最大值'),
                opts.MarkLineItem(type_='min',name='最小值'),
            ]
        )
    )
)
bar.render_notebook()
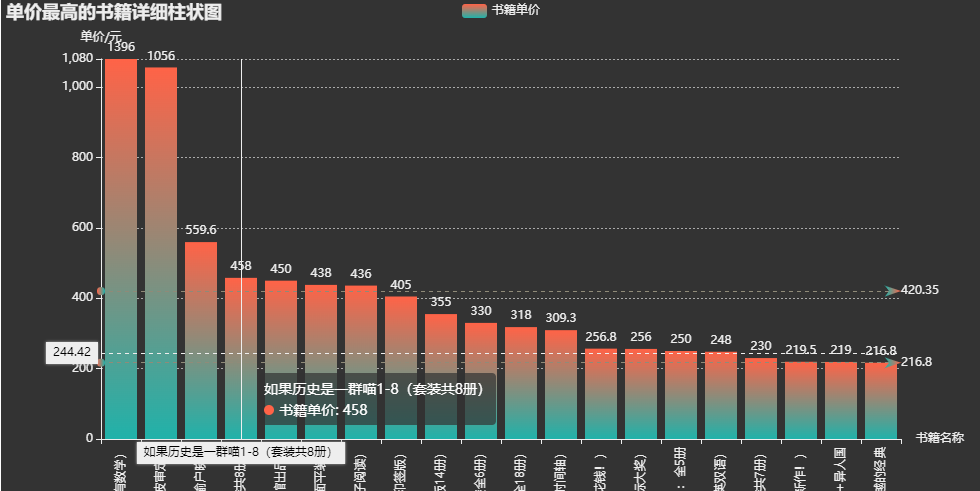
書籍評論數最高Top20:
bar=(
    Bar(init_opts=opts.InitOpts(height='500px',width='1000px',theme='dark'))
    .add_xaxis(price_top.index.tolist())
    .add_yaxis(
        '書籍單價',
        price_top.values.tolist(),
        label_opts=opts.LabelOpts(is_show=True,position='top'),
        itemstyle_opts=opts.ItemStyleOpts(
            color=JsCode("""new echarts.graphic.LinearGradient(
            0, 0, 0, 1,[{offset: 0,color: 'rgb(255,99,71)'}, {offset: 1,color: 'rgb(32,178,170)'}])
            """
            )
        )
    )
    .set_global_opts(
        title_opts=opts.TitleOpts(
            title='單價最高的書籍詳細柱狀圖'),
            xaxis_opts=opts.AxisOpts(name='書籍名稱',
            type_='category',
            axislabel_opts=opts.LabelOpts(rotate=90),
        ),
        yaxis_opts=opts.AxisOpts(
            name='單價/元',
            min_=0,
            max_=1080.0,
            splitline_opts=opts.SplitLineOpts(is_show=True,linestyle_opts=opts.LineStyleOpts(type_='dash'))
        ),
        tooltip_opts=opts.TooltipOpts(trigger='axis',axis_pointer_type='cross')
    )

    .set_series_opts(
        markline_opts=opts.MarkLineOpts(
            data=[
                opts.MarkLineItem(type_='average',name='均值'),
                opts.MarkLineItem(type_='max',name='最大值'),
                opts.MarkLineItem(type_='min',name='最小值'),
            ]
        )
    )
)
bar.render_notebook()
到此這篇關於Python爬取當網書籍數據並數據可視化展示的文章就介紹到這瞭,更多相關Python爬取當網書籍數據內容請搜索WalkonNet以前的文章或繼續瀏覽下面的相關文章希望大傢以後多多支持WalkonNet!
推薦閱讀:
- Python爬蟲入門案例之爬取去哪兒旅遊景點攻略以及可視化分析
- Python pyecharts Line折線圖的具體實現
- Python爬蟲爬取疫情數據並可視化展示
- 利用Python實時獲取steam特惠遊戲數據
- Python機器學習之使用Pyecharts制作可視化大屏