matplotlib之pyplot模塊之標題(title()和suptitle())
matplotlib 源碼解析標題實現(窗口標題,標題,子圖標題不同之間的差異)添加鏈接描述簡單比較瞭matplotlib中的標題。
使用title()設置子圖標題
title()可同時在子圖中顯示中間、左側、右側3個標題。
函數簽名為matplotlib.pyplot.title(label, fontdict=None, loc=None, pad=None, *, y=None, **kwargs)
參數作用及取值如下:
label:類型為字符串,即標題文本。fontdict:類型為字典,控制文本的字體屬性。默認值為:
{'fontsize': rcParams['axes.titlesize'],
 'fontweight': rcParams['axes.titleweight'],
 'color': rcParams['axes.titlecolor'],
 'verticalalignment': 'baseline',
 'horizontalalignment': loc}
loc:取值范圍為{'left', 'center', 'right'},默認值為rcParams["axes.titlelocation"]('center'),即標題的位置。y:類型為浮點數,默認值為rcParams["axes.titley"] (None)。即標題在子圖中的垂直距離,單位為子圖高度的百分比,1.0在子圖最頂部,默認值None則自動確定標題位置,避免與其他元素重疊。pad:類型為浮點數,默認值為default: rcParams["axes.titlepad"] (6.0)。即標題與子圖的填充距離(內邊距)。**kwargs:Text對象關鍵字屬性,用於控制文本的外觀屬性,如字體、文本顏色等。
返回值為Text對象。
title()相關rcParams為:
#axes.titlelocation: center # alignment of the title: {left, right, center}
#axes.titlesize:   large  # fontsize of the axes title
#axes.titleweight:  normal # font weight of title
#axes.titlecolor:  auto  # color of the axes title, auto falls back to
               # text.color as default value
#axes.titley:    None  # position title (axes relative units). None implies auto
#axes.titlepad:   6.0   # pad between axes and title in points
底層相關方法為:
Axes.set_title(self, label, fontdict=None, loc=None, pad=None, *, y=None, **kwargs)
Axes.get_title(self, loc='center'):註意返回指定位置的標題文本。
案例
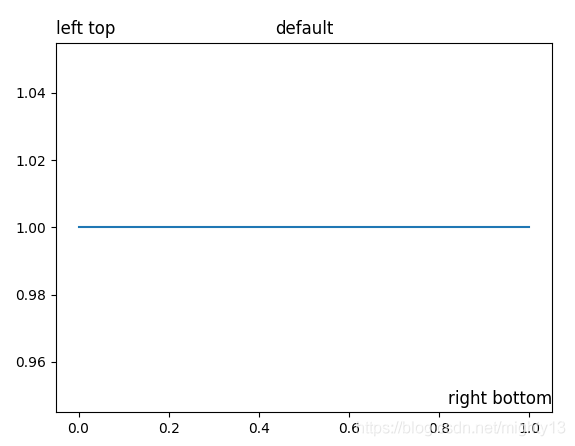
同時設置3個子圖標題。
import matplotlib.pyplot as plt

# 註意,子圖可以同時設置中間、左側、右側3個標題
plt.plot([1, 1])
# 在右側底部顯示子圖標題
plt.title("right bottom",y=0,loc='right')
# 在左側頂部顯示子圖標題
plt.title("left top",y=1,loc='left')
# 顯示默認子圖標題
plt.title("default")
plt.show()
使用suptitle()設置圖像標題
為圖像添加一個居中標題。
函數簽名為matplotlib.pyplot.suptitle(t, **kwargs)
參數作用及取值如下:
t:類型為字符串,即標題文本。x:類型為浮點數,即標題在圖像水平方向相對位置,默認值為0.5。y:類型為浮點數,即標題在圖像垂直方向相對位置,默認值為0.98。fontdict:類型為字典,控制文本的字體屬性。默認值為:
{'fontsize': rcParams['axes.titlesize'],
 'fontweight': rcParams['axes.titleweight'],
 'color': rcParams['axes.titlecolor'],
 'verticalalignment': 'baseline',
 'horizontalalignment': loc}
horizontalalignment, ha:類型為字符串,取值范圍{'center', 'left', right'},默認值為'center',即相對於(x,y)的水平方向對齊方式。verticalalignment, va:類型為字符串,取值范圍{'top', 'center', 'bottom', 'baseline'},默認值為'top',即相對於(x,y)的垂直方向對齊方式。fontsize, size:取值范圍為浮點數或{'xx-small', 'x-small', 'small', 'medium', 'large', 'x-large', 'xx-large'},默認值為rcParams["figure.titlesize"] ('large'),文本的字體大小。fontweight, weight:取值范圍詳見文檔,字即文本的字重。**kwargs:Text對象關鍵字屬性,用於控制文本的外觀屬性,如字體、文本顏色等。
返回值為Text對象。
suptitle()相關rcParams為:
#figure.titlesize:  large   # size of the figure title (``Figure.suptitle()``)
#figure.titleweight: normal  # weight of the figure title
案例
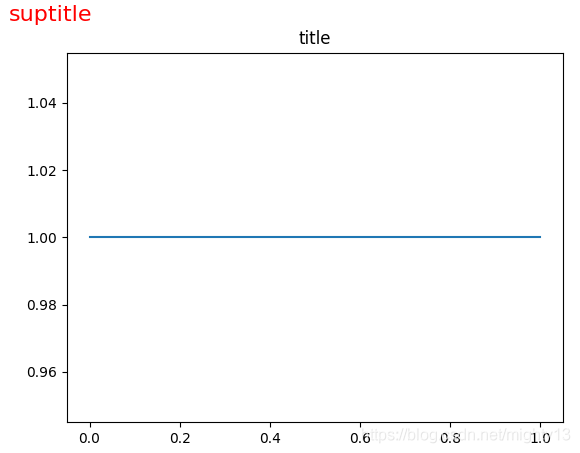
添加圖像標題,並設置坐標、字體大小、文本顏色等屬性。
import matplotlib.pyplot as plt

plt.plot([1, 1])
plt.title("title")
plt.suptitle("suptitle", x=0.1, y=0.98, fontsize=16, color='red')

plt.show()
到此這篇關於matplotlib之pyplot模塊之標題(title()和suptitle())的文章就介紹到這瞭,更多相關matplotlib title()和suptitle()內容請搜索WalkonNet以前的文章或繼續瀏覽下面的相關文章希望大傢以後多多支持WalkonNet!
推薦閱讀:
- matplotlib源碼解析標題實現(窗口標題,標題,子圖標題不同之間的差異)
- matplotlib之pyplot模塊坐標軸標簽設置使用(xlabel()、ylabel())
- 詳解Python中matplotlib模塊的繪圖方式
- Python+matplotlib繪制多子圖的方法詳解
- 手把手教你用Matplotlib實現數據可視化