Facebook開源一站式服務python時序利器Kats詳解
轉自微信公眾號:機器學習社區,經作者授權轉載
時間序列分析是數據科學中一個非常重要的領域,它主要包含統計分析、檢測變化點、異常檢測和預測未來趨勢。然而,這些時間序列技術通常由不同的庫實現。有沒有一種方法可以讓你在一個庫中獲得所有這些技術?
答案是肯定的,本文中我將分享一個非常棒的工具包 Kats,它可以完美解決上述問題。
什麼是 Kats?
目前時間序列分析以及建模的技術非常多,但相對散亂,本次 FaceBook 開源瞭 Kats,它是一款輕量級的、易於使用的、通用的時間序列分析框架,包括:預測、異常檢測、多元分析和特征提取嵌入。你可以將 Kats 視為 Python 中時間序列分析的一站式工具包。
安裝 Kats
pip install --upgrade pip
pip install kats
為瞭瞭解 Kats 的功能,我們將使用這個框架來分析 Kaggle 上的 StackOverflow問題計數問題。數據鏈接為:https://www.kaggle.com/aishu200023/stackindex
首先我們從讀取數據開始。
import pandas as pd
df = pd.read_csv("MLTollsStackOverflow.csv")
# Turn the month column into datetime
df["month"] = pd.to_datetime(df["month"], format="%y-%b")
df = df.set_index("month")
現在讓我們分析一下與 Python 相關的 StackOverflow 問題計數。數據被分成一列和一個測試集來評估預測。
python = df["python"].to_frame()

# Split data into train and test set
train_len = 102
train = python.iloc[:train_len]
test = python.iloc[train_len:]
將數據轉換為時間序列
首先構造一個時間序列對象。我們使用time_col_name='month'指定時間列。
from kats.consts import TimeSeriesData

# Construct TimeSeriesData object
ts = TimeSeriesData(train.reset_index(), time_col_name="month")
要繪制數據,調用plot方法:
ts.plot(cols=["python"])
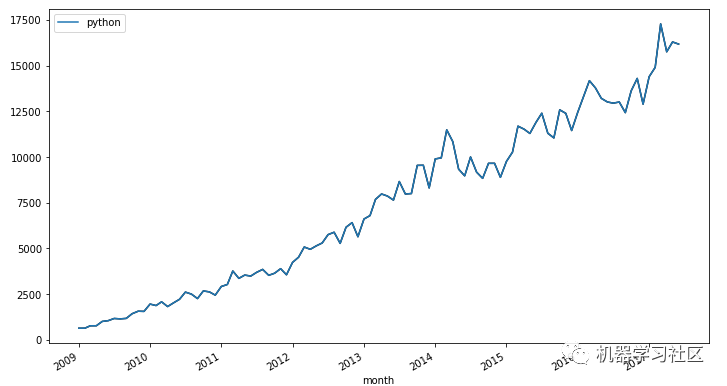
酷!看起來關於 Python 的問題的數量隨著時間的推移而增加。我們能預測未來30天的趨勢嗎?是的,我們可以和 Kats 一起做。
預測
Kats目前支持以下10種預測模型:
Linear
Quadratic
ARIMA
SARIMA
Holt-Winters
Prophet
AR-Net
LSTM
Theta
VAR
上述模型較多,讓我們試一下其中兩種類型吧!
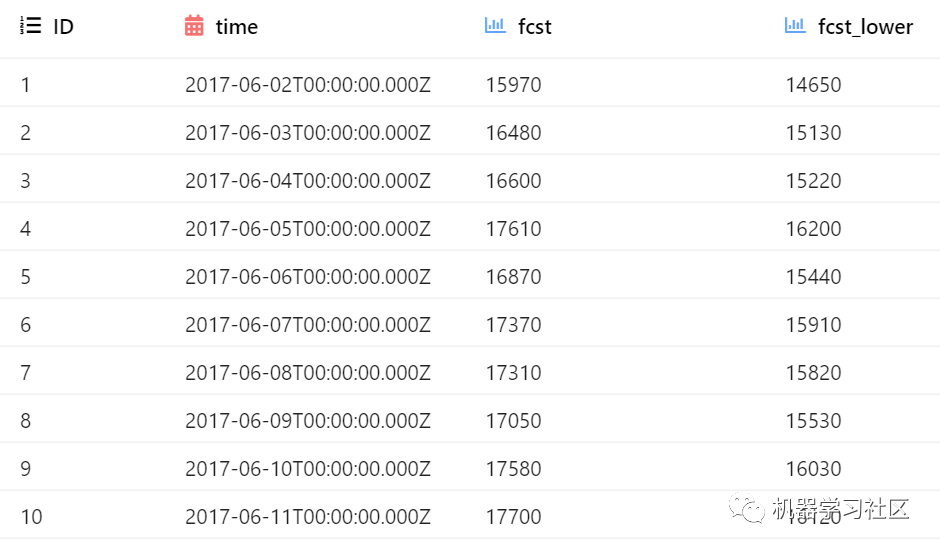
從使用 Prophet 進行預測開始:
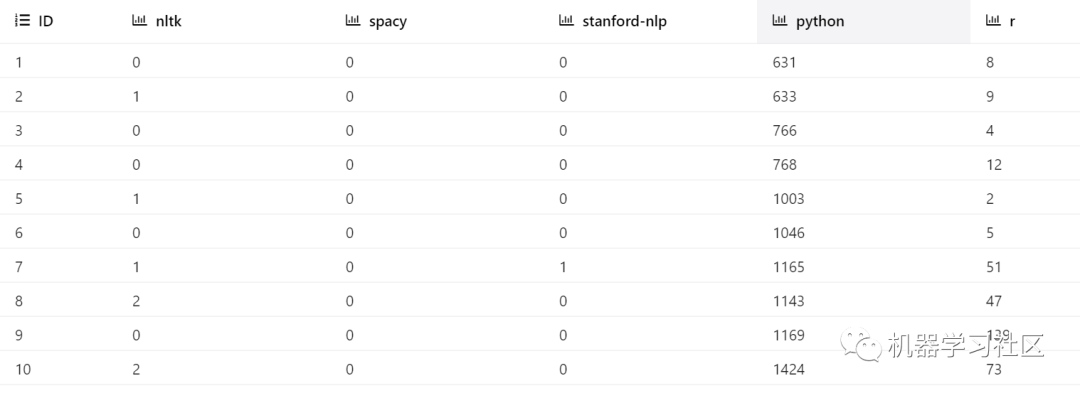
from kats.models.prophet import ProphetModel, ProphetParams
# Specify parameters
params = ProphetParams(seasonality_mode="multiplicative")
# Create a model instance
m = ProphetModel(ts, params)
# Fit mode
m.fit()
# Forecast
fcst = m.predict(steps=30, freq="MS")
fcst
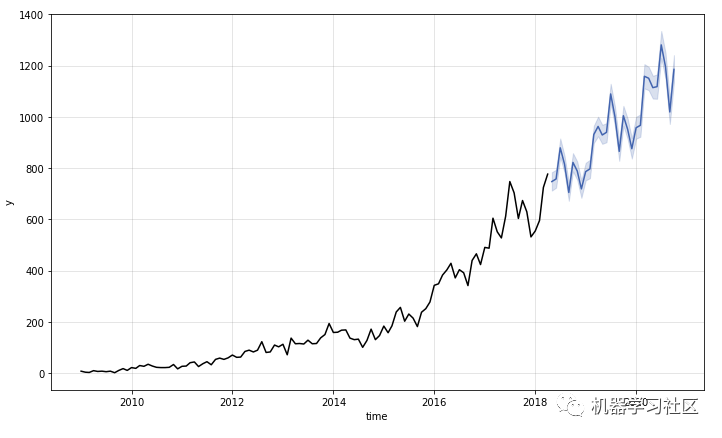
可視化
m.plot()

酷!讓我們通過與測試數據的比較來評估預測。
import matplotlib.pyplot as plt
fig, ax = plt.subplots(figsize=(12, 7))
train.plot(ax=ax, label="train", color="black")
test.plot(ax=ax, color="black")
fcst.plot(x="time", y="fcst", ax=ax, color="blue")
ax.fill_between(test.index, fcst["fcst_lower"], fcst["fcst_upper"], alpha=0.5)
ax.get_legend().remove()
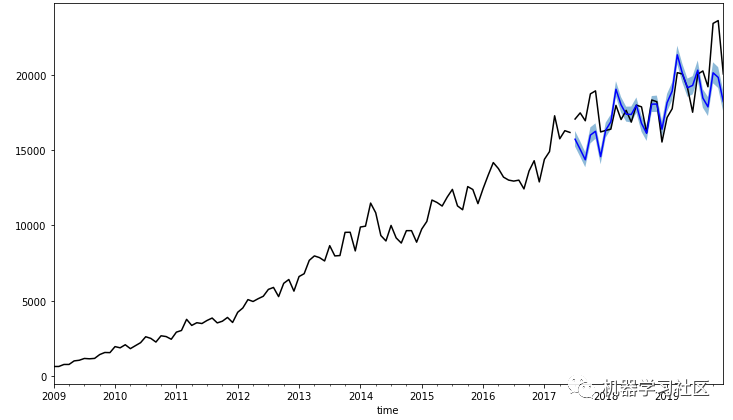
預報似乎很好地符合觀察結果!
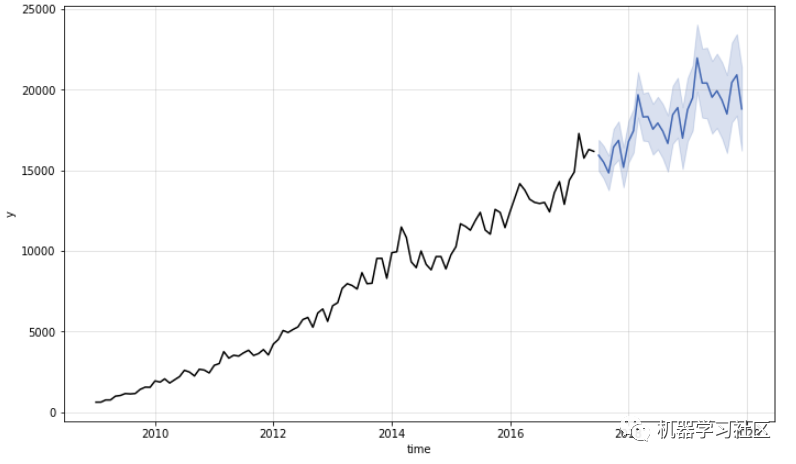
Holt-Winters
我們將嘗試的下一個模式是Holt-Winters。它是一種捕捉季節性的方法。下面是如何在 Kats 中使用 Holt-Winters 方法。
from kats.models.holtwinters import HoltWintersParams, HoltWintersModel
import warnings
warnings.simplefilter(action='ignore')
params = HoltWintersParams(
            trend="add",
            seasonal="mul",
            seasonal_periods=12,
        )
m = HoltWintersModel(
    data=ts,
    params=params)
m.fit()
fcst = m.predict(steps=30, alpha = 0.1)
m.plot()
檢測變化點
你有沒有想過在你的時間序列中發生統計上顯著的均值變化的時間?
Kats 允許使用 CUSUM 算法檢測變化點。Cusum 是一種檢測時間序列中均值上下移動的方法。
讓我們看看如何檢測 Kats 中的變化點。
from kats.consts import TimeSeriesData, TimeSeriesIterator
from kats.detectors.cusum_detection import CUSUMDetector
import matplotlib.pyplot as plt
detector = CUSUMDetector(ts)
change_points = detector.detector(change_directions=["increase", "decrease"])
print("The change point is on", change_points[0][0].start_time)
# plot the results
plt.xticks(rotation=45)
detector.plot(change_points)
plt.show()
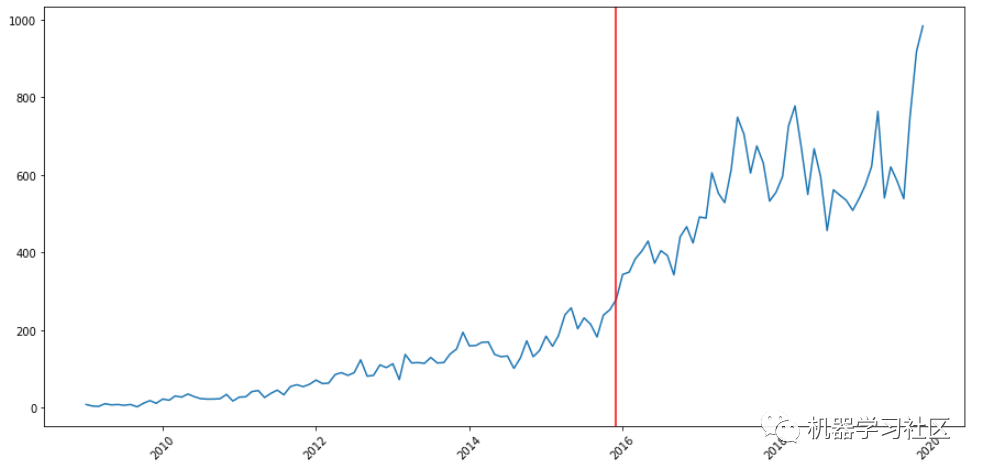
酷!讓我們嘗試檢測 StackOverflow 問題計數的其他類別的變化點。
首先創建一個函數來檢測主題提供的更改點。
def get_ts(topic: str):
    return TimeSeriesData(df[topic].to_frame().reset_index(), time_col_name="month")

def detect_change_point(topic: str):
    ts = get_ts(topic)
    detector = CUSUMDetector(ts)

    change_points = detector.detector()
    for change_point in change_points:
        print("The change point is on", change_point[0].start_time)

    # plot the results
    plt.xticks(rotation=45)
    detector.plot(change_points)
    plt.show()
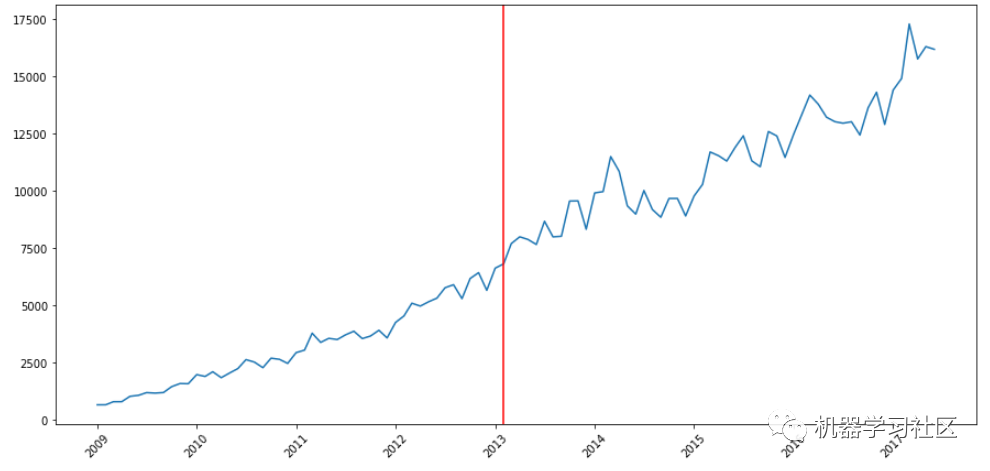
機器學習
detect_change_point("machine-learning")
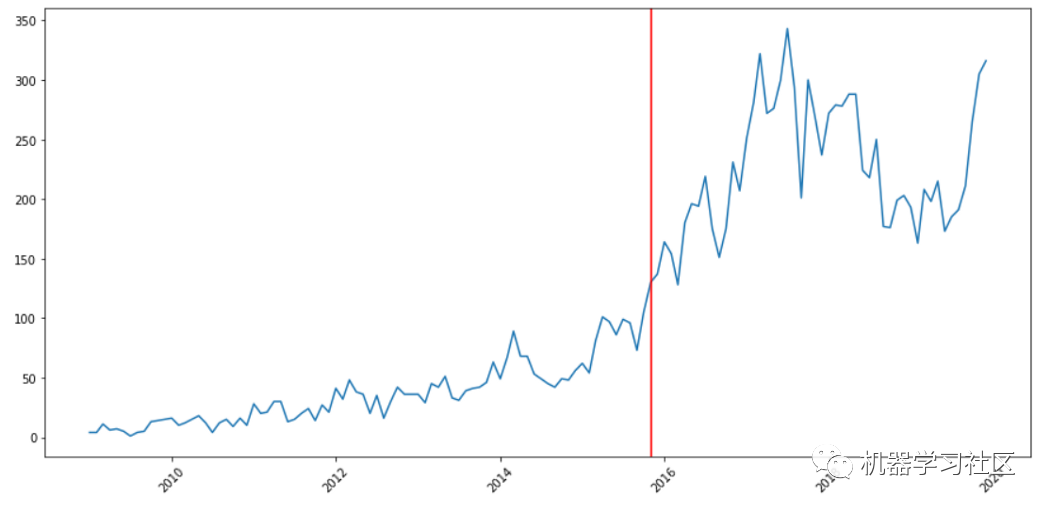
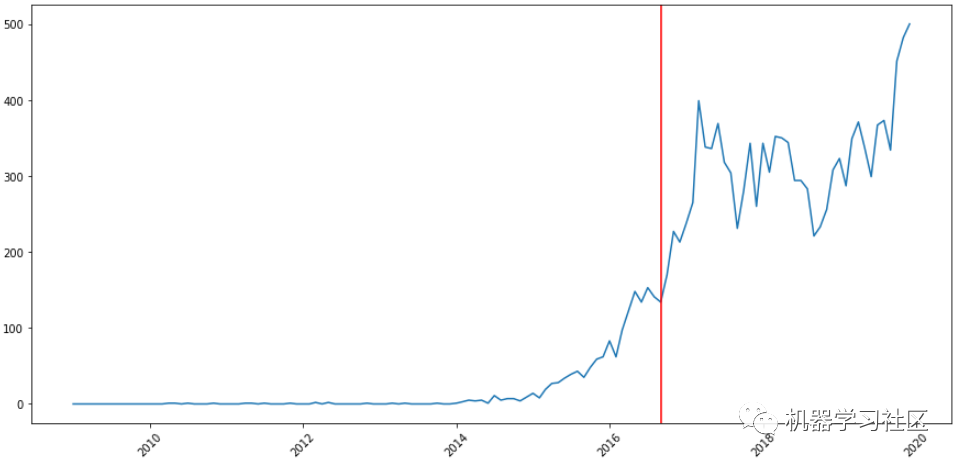
深度學習
detect_change_point("deep-learning")
孤立點檢測
你在看NLP的時間序列時看到瞭什麼?
df["nlp"].plot()
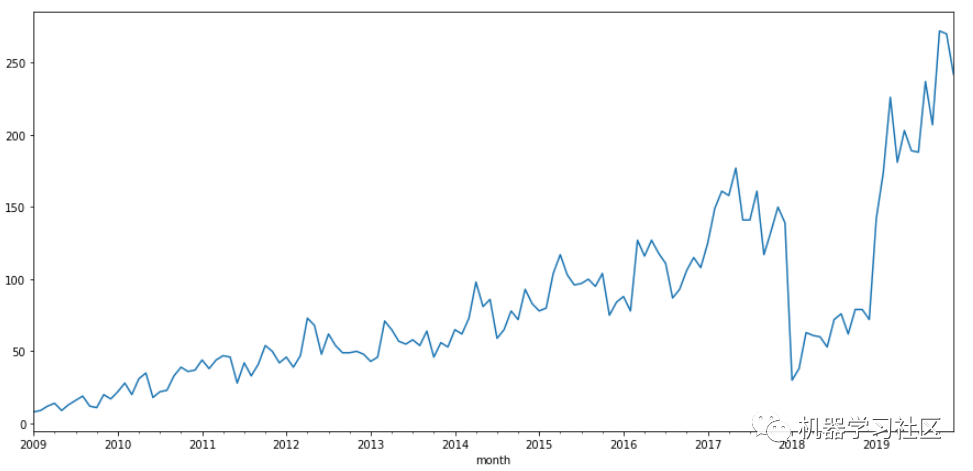
從2018年到2019年,NLP的問題數量有所下降。
問題數量的下降是一個異常值。檢測異常值很重要,因為它們可能會在下遊處理中造成問題。
然而,通過查看數據來發現異常值並不總是高效和容易的。幸運的是,Kats還允許您檢測時間序列中的異常值!
用kat檢測異常值隻需要幾行行代碼。
from kats.detectors.outlier import OutlierDetector

# Get time series object
ts = get_ts("nlp")

# Detect outliers
ts_outlierDetection = OutlierDetector(ts, "additive")
ts_outlierDetection.detector()

# Print outliers
outlier_range1 = ts_outlierDetection.outliers[0]
print(f"The outliers range from {outlier_range1[0]} to {outlier_range1[1]}")
The outliers range from 2018-01-01 00:00:00 to 2019-03-01 00:00:00
酷!結果證實瞭我們從上圖中看到的情況。
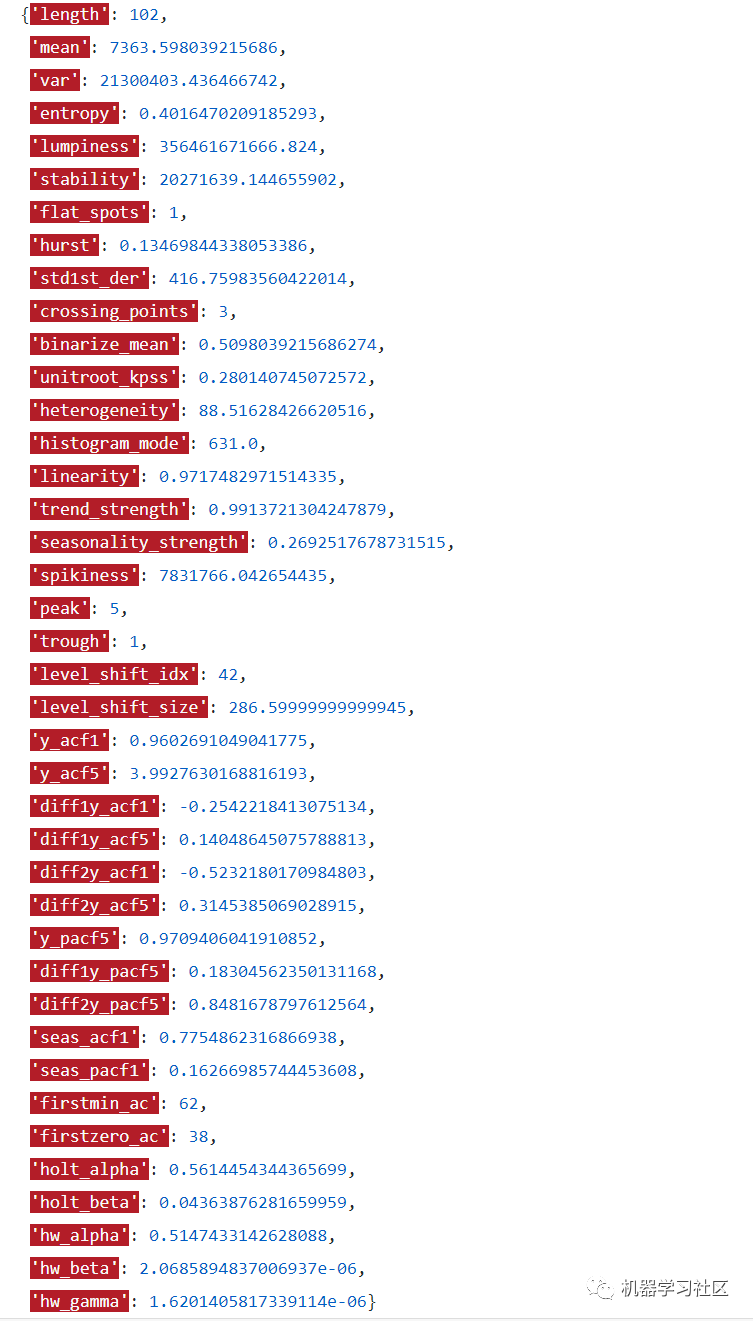
時間序列特征
除瞭統計數據外,時間序列中還有其他一些特性,如線性、趨勢強度、季節性強度、季節性參數等,您可能會感興趣。
Kats 允許通過 TsFeatures 查找有關時間序列特征的重要信息:
from kats.tsfeatures.tsfeatures import TsFeatures

model = TsFeatures()

output_features = model.transform(ts)
output_features
小結
我們剛剛學習瞭如何使用 Kats 來預測、檢測變化點、檢測異常值和提取時間序列特征。我希望這篇文章能幫助到大傢解決工作中的時間序列問題,並從數據中提取有價值的信息。
以上就是Facebook開源一站式服務python時序利器Kats詳解的詳細內容,更多關於Facebook開源時序利器Kats的資料請關註WalkonNet其它相關文章!